Distributed tracing is a technique used to profile and monitor applications which span more than one process. It is especially useful for distributed architectures - for example based on microservices. Tracing helps to track performance bottlenecks and pinpoint where failures occur. Strimzi 0.14.0 allows you to enable tracing in some of the components which are part of Apache Kafka - in particular in Kafka Connect and Kafka Mirror Maker. This blog post will show how to use tracing not just within the Strimzi project but also in Kafka clients generally.
Tracing can help address important aspects of complex systems:
- Monitor the flow of events within a distributed system.
- Monitor performance and latency and help to optimize it.
- Find a root cause of problems within a distributed system.
- Analyze and monitor the dependencies between (micro)services.
Apache Kafka is often used as a backbone of micro-service based architectures. Events might flow in or out of your system using Kafka Connect. They will be processed and exchanged between Kafka consumers and producers or maybe using the Kafka Streams API. They might also be mirrored between smaller Kafka clusters or data centers using Mirror Maker. Support for tracing is important because it can help you to monitor the flow of the events, discover performance bottlenecks or errors and more.
OpenTracing and Jaeger
The tracing support in Strimzi is based on two open source projects:
Both projects are part of the Cloud Native Computing Foundation.
OpenTracing is a vendor-neutral API for distributed tracing which supports different protocols and programming languages. OpenTracing itself doesn’t implement tracing. It only provides an interoperable API for multiple programming languages. Other projects use these APIs to build the actual tracing implementation on top of them.
One such project which implements the OpenTracing API is Jaeger. Jaeger provides several components. The Jaeger client runs as part of your application. This would be, for example, your Kafka producer or consumer, or one of the Kafka components managed by the Strimzi operator, such as Kafka Connect or Mirror Maker. The application uses the OpenTracing API to create tracing spans and attach trace ids to outgoing requests. The Jaeger client is responsible for propagating the information about the spans to the Jaeger agent. The Jaeger agent is running as a separate process, often as a Kubernetes DaemonSet. From the Jaeger agent the tracing information will be further passed to the Jaeger collector, ingester and query components. For the full description of the Jaeger architecture please see Jaeger documentation.
The client doesn’t usually send all traces to the agent but often only a small percentage. A sampling configuration can define how many traces will be sent to the agent. It can be configured either in the client directly or you can configure the client to get this configuration from the Jaeger agent. That will let you manage the sampling configuration centrally for all your applications.
The OpenTracing project also contains a contributions repository which contains many integrations between the OpenTracing APIs and other projects.
Consumer and Producer APIs
OpenTracing has a contributions project which already adds tracing support to the Consumer and Producer APIs. It will take care of managing the tracing spans, adding the trace IDs to the the records when they are sent or reading them from records when they are received. It has two ways how to enable tracing:
- Using wrappers around the
KafkaConsumerandKafkaProducerclasses - Using
Interceptorclasses which can be plugged into the ApacheKafkaConsumerandKafkaProducerclasses.
To use the wrapper classes, all you need to do is to use an instance of the TracingKafkaProducer or TracingKafkaConsumer class instead of the corresponding Apache class.
You have to pass the original KafkaProducer or KafkaConsumer when creating the wrapper class.
Once created, the wrapper class provides the same interface as the original Kafka classes and can be used in the same way.
// Producer
KafkaProducer producer = new KafkaProducer(props);
TracingKafkaProducer tracingProducer = new TracingKafkaProducer(producer);
tracingProducer.send(new ProducerRecord("my-topic","Hello world"));

// Consumer
KafkaConsumer consumer = new KafkaConsumer(props);
TracingKafkaConsumer tracingConsumer = new TracingKafkaConsumer(consumer);
tracingConsumer.subscribe(Collections.singletonList("my-topic"));
tracingConsumer.poll(Long.MAX_VALUE);
Alternatively, To use the interceptors, all you need to do is to set the interceptor class in the producer or consumer configuration:
// Producer
props.put(ProducerConfig.INTERCEPTOR_CLASSES_CONFIG, TracingProducerInterceptor.class.getName());

// Consumer
props.put(ConsumerConfig.INTERCEPTOR_CLASSES_CONFIG, TracingConsumerInterceptor.class.getName());
You don’t have to do anything else.
You use the KafkaProducer and KafkaConsumer classes as normal and the interceptors will take care of the rest.
For more information about the wrapper clients or the interceptors, check the documentation of the Kafka OpenTracing instrumentation project.
But this is only the first part of the work. We also need to configure the tracer. The tracer is an OpenTracing API interface to the Jaeger client which will collect the tracing information and pass it to the Jaeger backend. The easiest way how to do it is to use a global tracer and configure it using environment variables. First, we need to create the tracer it self and have it initialized from the environment variables:
Tracer tracer = Configuration.fromEnv().getTracer();
Next we need to set this tracer as global. The global tracer will be automatically found by the wrappers or the interceptor classes.:
GlobalTracer.registerIfAbsent(tracer);
Of course, we will need to also set the environment variables to configure the tracer. The full list of supported variables and their meaning can be found here. There are also other ways of initializing the tracer - you can check them in the Jaeger documentation.
Streams API
Tracing can also be used in applications based on the Streams API. You can enable Kafka Open Tracing instrumentation in Kafka Streams applications by:
- Adding the jars as a dependency to your project.
- Using the
KafkaClientSupplierto tell the Streams API to use the wrapped Kafka consumer and producer clients. You can do that when creating theKafkaStreamsinstance:
StreamsBuilder builder = ...;
Properties props = ...;
KafkaClientSupplier supplier = new TracingKafkaClientSupplier(tracer);
streams = new KafkaStreams(builder.build(), props, supplier);
The TracingKafkaClientSupplier class in the example above is provided by the Kafka Open Tracing instrumentation project.
For more information, check the documentation of the Kafka OpenTracing instrumentation project. The tracer needs to be configured in the same way as for the Producer and Consumer APIs.
Connect and Mirror Maker
Kafka Connect and Mirror Maker are essentially wrappers around the Consumer and Producer APIs. Their configuration contains configuration of the consumers and producers. So we can easily enable tracing in the same way as was described for the Consumer and Producer APIs.
Of course with Strimzi, you do not have to configure it directly. All you have to do is to enable tracing in the custom resource:
# ...
tracing:
  type: jaeger
# ...
Strimzi will also initialize the Jaeger tracer.
But you do need to specify the required environment variables needed to configure the Jaeger tracer.
That can be done directly in the custom resource using the template property.
The following example shows the configuration of the environment variables for Mirror Maker.
It configures the Jaeger client to:
- Use the service name
my-mirror-maker. - Send the traces to the Jaeger agent running on the address
my-jaeger-agent. - Send all traces to the agent.
# ...
template:
  mirrorMakerContainer:
    env:
    - name: JAEGER_SERVICE_NAME
      value: my-mirror-maker
    - name: JAEGER_AGENT_HOST
      value: my-jaeger-agent
    - name: JAEGER_SAMPLER_TYPE
      value: const
    - name: JAEGER_SAMPLER_PARAM
      value: "1"
# ...
The full list of supported variables and their meaning can be found here.
The rest of the configuration will be done for you by the Strimzi operator.
Kafka Connect connectors
When you enable tracing in Kafka Connect, Strimzi will do two things:
- Create and register the global tracer.
- Configure the Kafka Connect consumers and producers to use the tracing interceptors.
That should make sure that Kafka Connect will trace all the messages it: 1) Gets from source connectors and sends them to the Kafka brokers. 2) Receives from Kafka brokers and passes them to the sink connectors.
However, it is up to the connectors to pass the information between Kafka and other systems (for sink connectors) or other systems and Kafka (source connectors). The connectors have access to headers of messages they consume or produce. They use the headers to extract or inject the tracing information and start their own tracing spans. For more information see the OpenTracing documentation about injecting and extracting the trace ids. They can use the global tracer created and registered by Strimzi to push the traces to Jaeger.
Kafka brokers
There is currently no tracing support in the Kafka brokers. But the tracing information which is stored in the headers of the Kafka messages will be of course delivered to the consumers. So there will be no specific spans when the message arrived to the broker and was sent out of the broker. But you will still be able to see when did the producer send the message and when did the consumer received it.
Tracing in other clients
The Kafka OpenTracing instrumentation project only supports the Java clients and the Spring Kafka library. But OpenTracing and Jaeger support many different languages. You may not need a dedicated support in your chosen language’s Kafka clients. The trace ids are sent as part of the Kafka messages in the headers. You can inject them into or extract them from the messages with any client that supports Kafka headers and start the tracing spans manually. For more details, see the OpenTracing documentation about injecting and extracting the tracing ids for more information.
Tracing in action
Now it is time to see it in action.
I will use my Kubernetes cluster running in Amazon AWS public cloud.
To make life easier, I will do everything in the namespace myproject.
So first I have to create it and set it as default:
kubectl create ns myproject
kubectl config set-context --current --namespace=myproject
Jaeger
Next I need to deploy Jaeger. The easiest way to do it is to use the Jaeger Operator. I will install it from OperatorHub.io. Go to the Jaeger Operator page, click the Install button in top right corner and follow the instructions.
You will need to first install the Operator Lifecycle Manager (unless you have it already installed):
curl -sL https://github.com/operator-framework/operator-lifecycle-manager/releases/download/0.12.0/install.sh | bash -s 0.12.0
And then install the Jaeger Operator it self:
kubectl create -f https://operatorhub.io/install/jaeger.yaml
Once the Jaeger operator is running, we have to create the Jaeger custom resource to deploy Jaeger:
cat <<EOF | kubectl apply -f -
apiVersion: jaegertracing.io/v1
kind: Jaeger
metadata:
  name: my-jaeger
spec:
  strategy: allInOne
  allInOne:
    image: jaegertracing/all-in-one:latest
    options:
      log-level: debug
  storage:
    type: memory
    options:
      memory:
        max-traces: 100000
  ingress:
    enabled: false
  agent:
    strategy: DaemonSet
  annotations:
    scheduler.alpha.kubernetes.io/critical-pod: ""
EOF
Now when Jaeger is deployed, you can use port-forward to access its UI on http://localhost:8080:
kubectl port-forward service/my-jaeger-query 8080:16686
Kafka cluster
At this point Jaeger is and we can deploy a Kafka cluster with Strimzi. We have to start by installing Strimzi itself:
curl -L https://github.com/strimzi/strimzi-kafka-operator/releases/download/0.14.0/strimzi-cluster-operator-0.14.0.yaml \
  | sed 's/namespace: .*/namespace: myproject/' \
  | kubectl apply -f -
Continue by deploying a Kafka cluster:
kubectl apply -f https://raw.githubusercontent.com/strimzi/strimzi-kafka-operator/0.14.0/examples/kafka/kafka-persistent.yaml
And wait until it deploys:
kubectl wait kafka/my-cluster --for=condition=Ready --timeout=300s
Clients
Once the Kafka cluster is ready, we can try some clients with tracing enabled. In Strimzi we have a repository with client examples which include things such as tracing or OAuth authentication. You can check the example source codes to see that it uses exactly what was described before in this blog post. We can deploy the tracing examples with following command:
kubectl apply -f https://raw.githubusercontent.com/strimzi/client-examples/master/deployment-tracing.yaml
The example includes a producer, consumer and streams applications. The producer sends a new message every second with a simple Hello World payload. The streams application will get the messages sent by the producer, reverse the text and send them to another topic. And the consumer will be just receiving the reversed messages from the streams applications.
The sampling in the example clients is configured to sample every single message, so we should not need to wait until the Nth message to get the traces.
So once the client examples get up and running, we can check their traces in the Jaeger UI which can be accessed using the port forward started earlier.
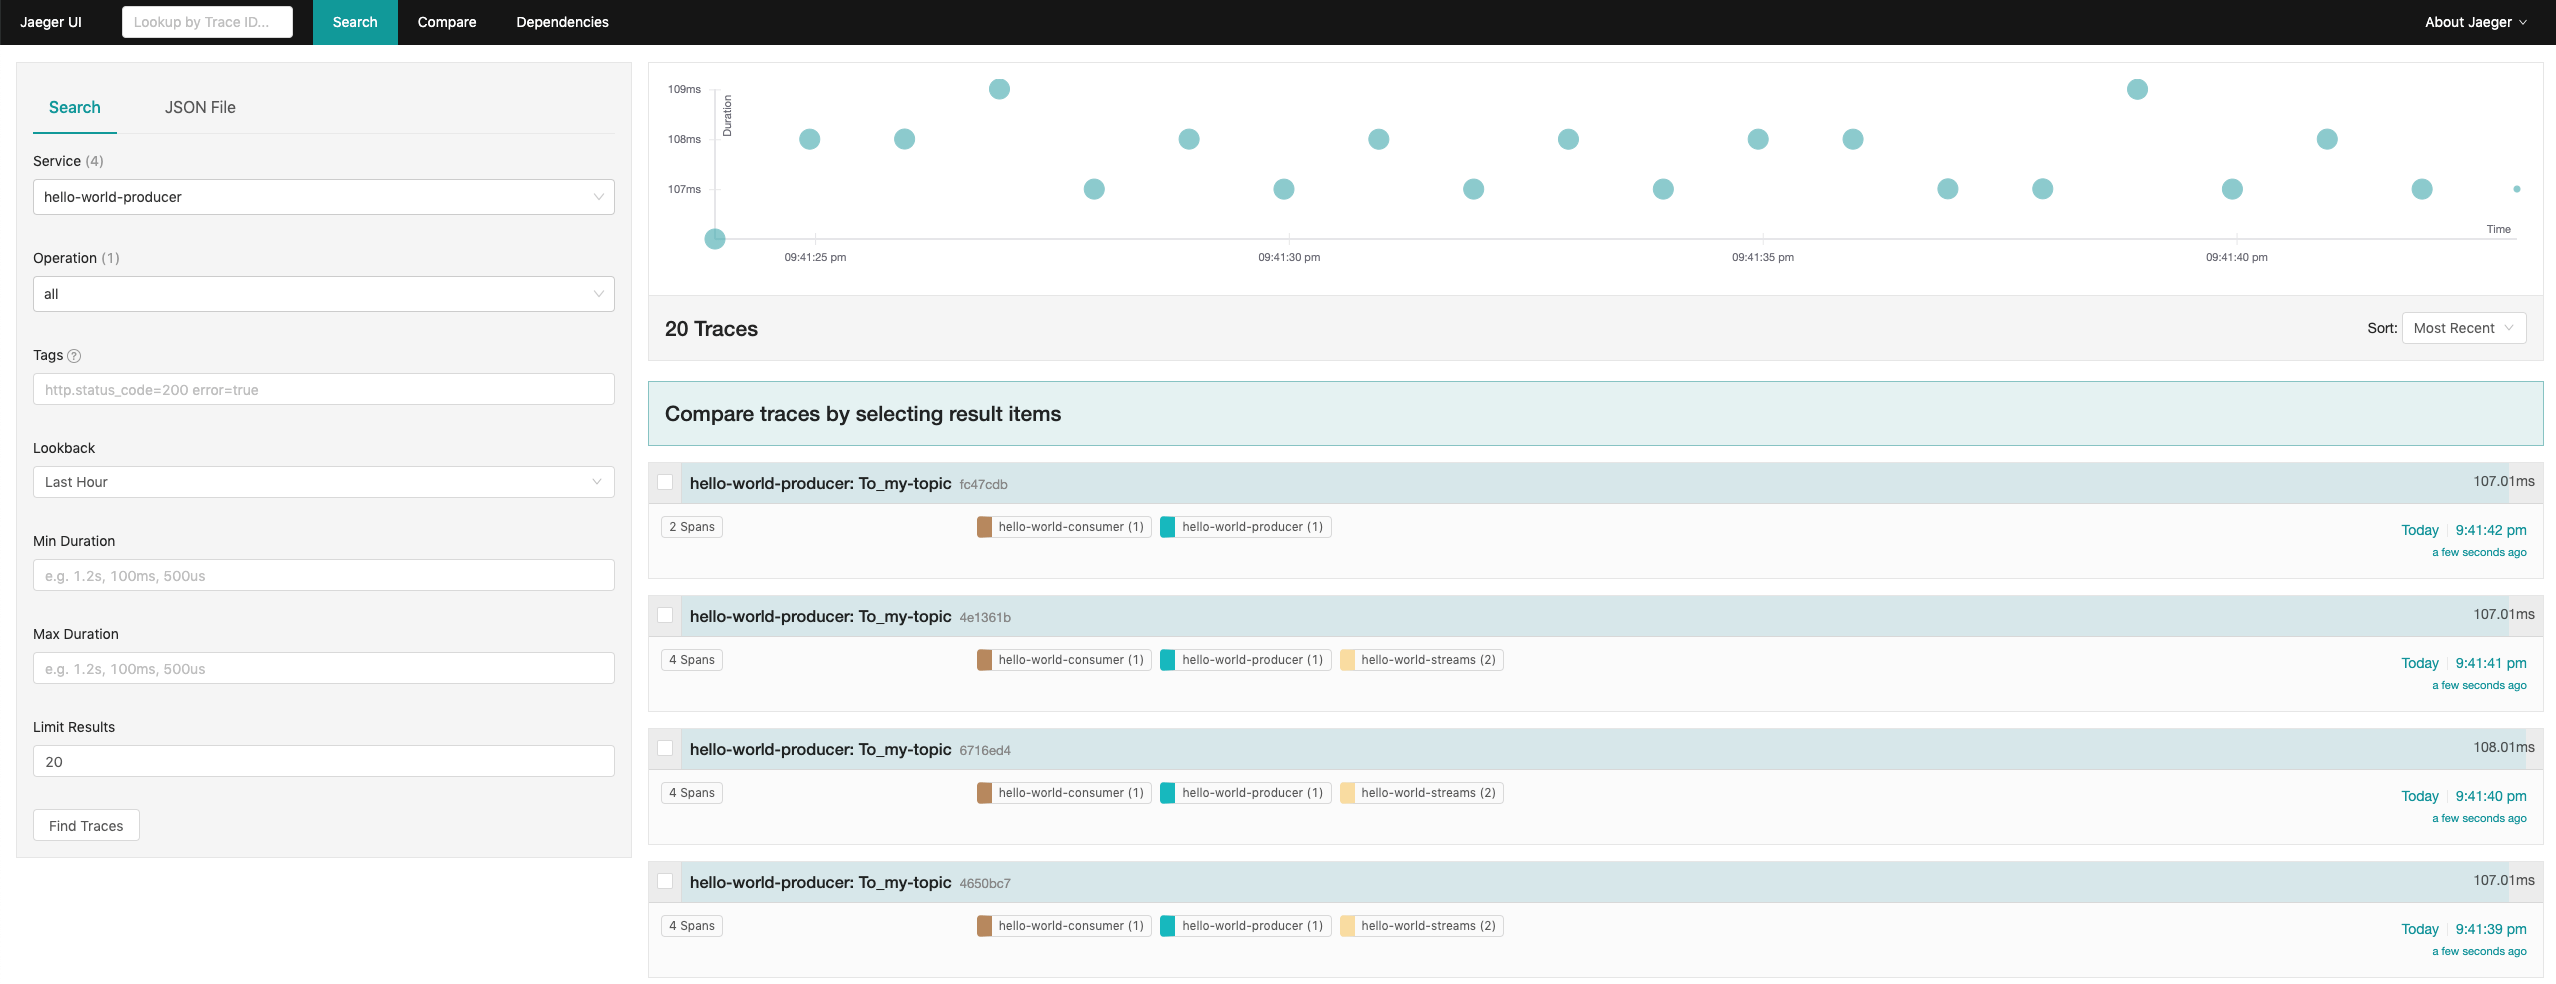
In the initial query window, select the service hello-world-producer and click on the Find Traces button.
You should see a bunch of traces, including a chart with their latencies.
Most of them should have 4 spans - one from the producer, two from the stream and one from the consumer.
There are two spans from the streams application because it receives the message, processes it and sends it again to another topics.
So there is one span for the consumer and one span for the producer.
Some traces will have less than 4 spans.
That happens when some traces have not yet been delivered and processed by Jaeger.
But if the missing spans don’t appear later, it might also indicate that the message got lost somewhere on its way to the end consumer.
A chart on the top of the search results shows the latencies of the traces which were found.
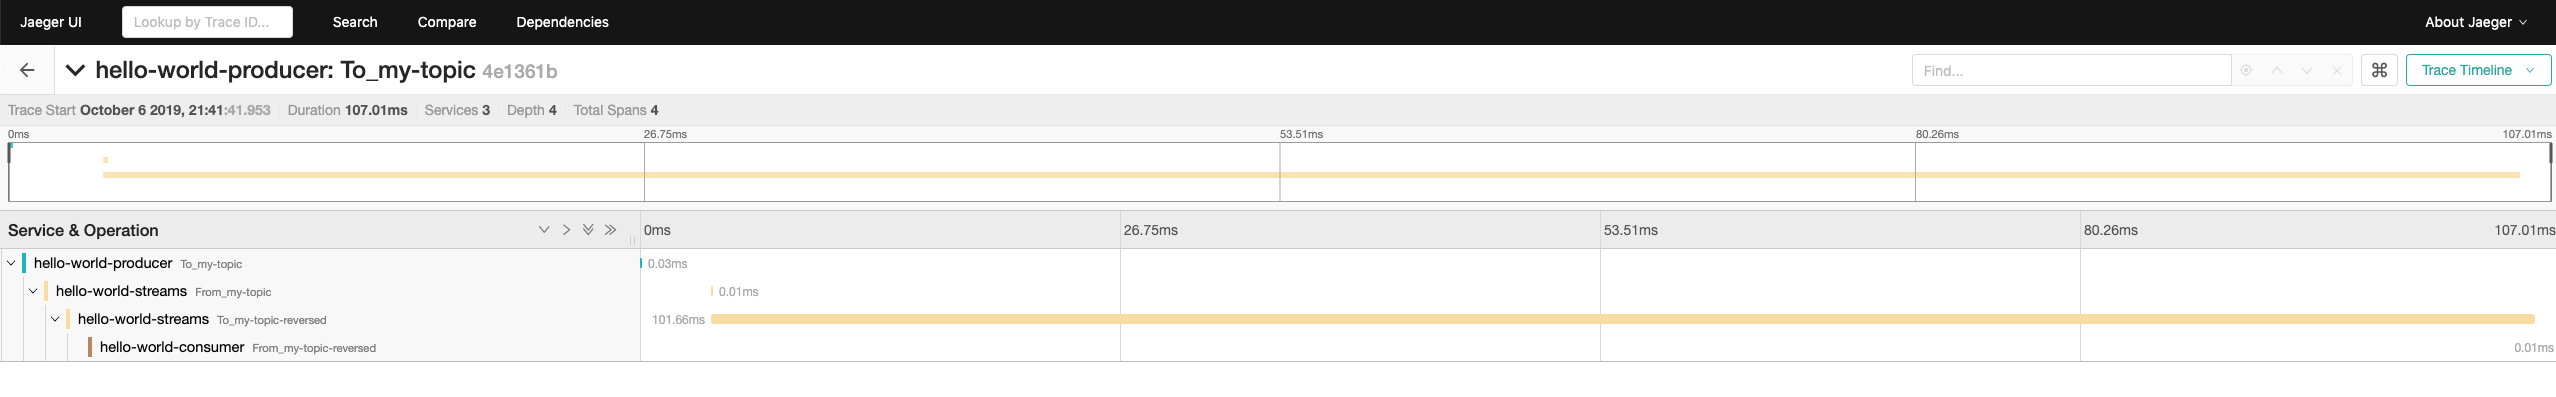
You can click on an individual trace to find more details about it. That will, by default, show a timeline graph with the different spans and how long they took.
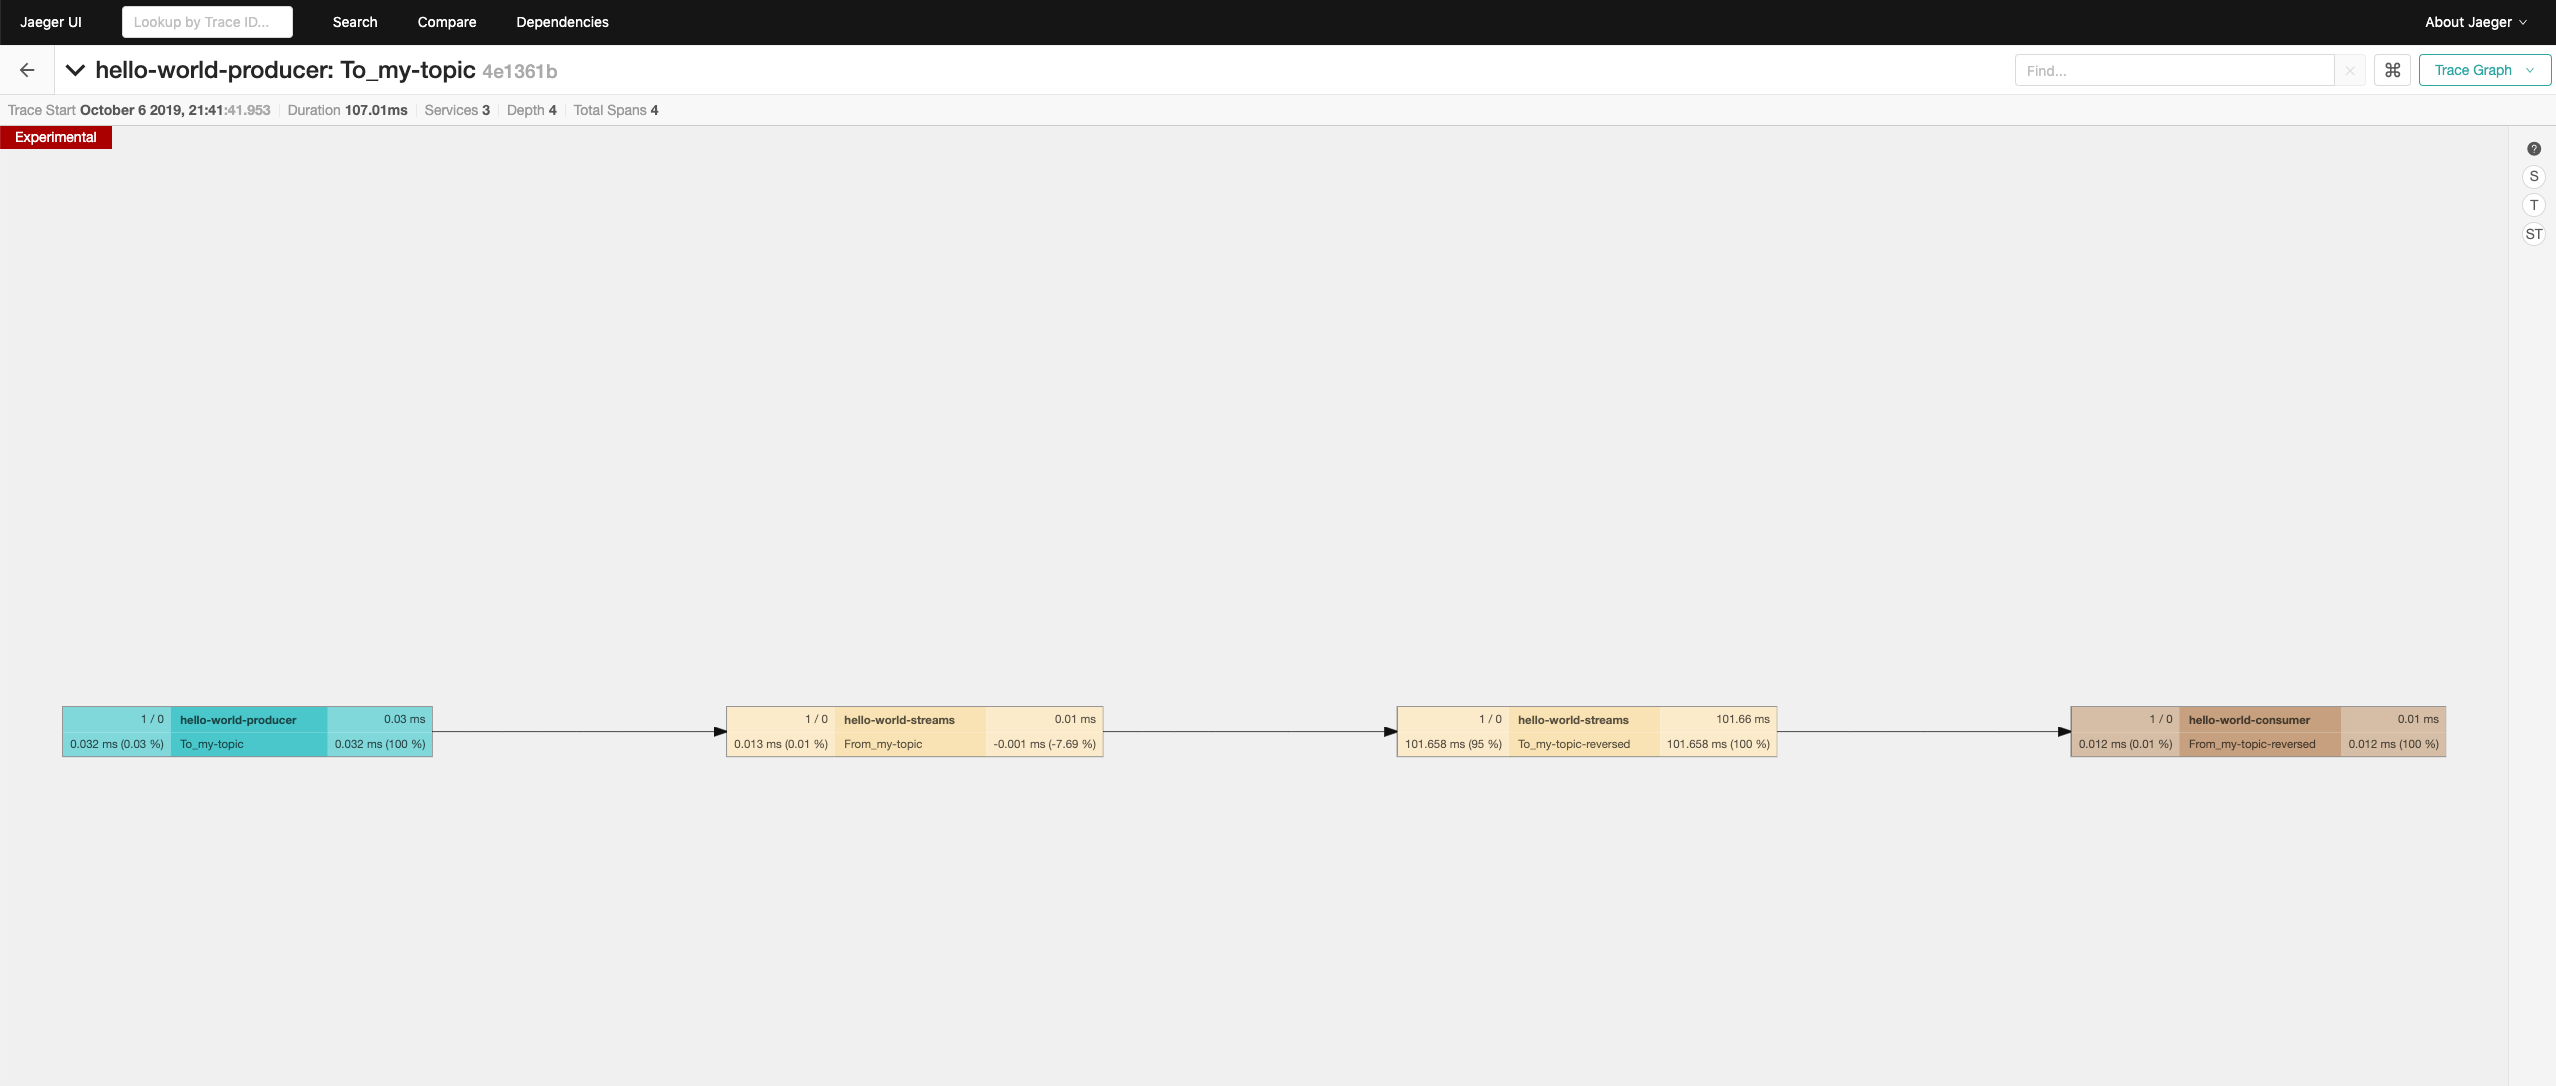
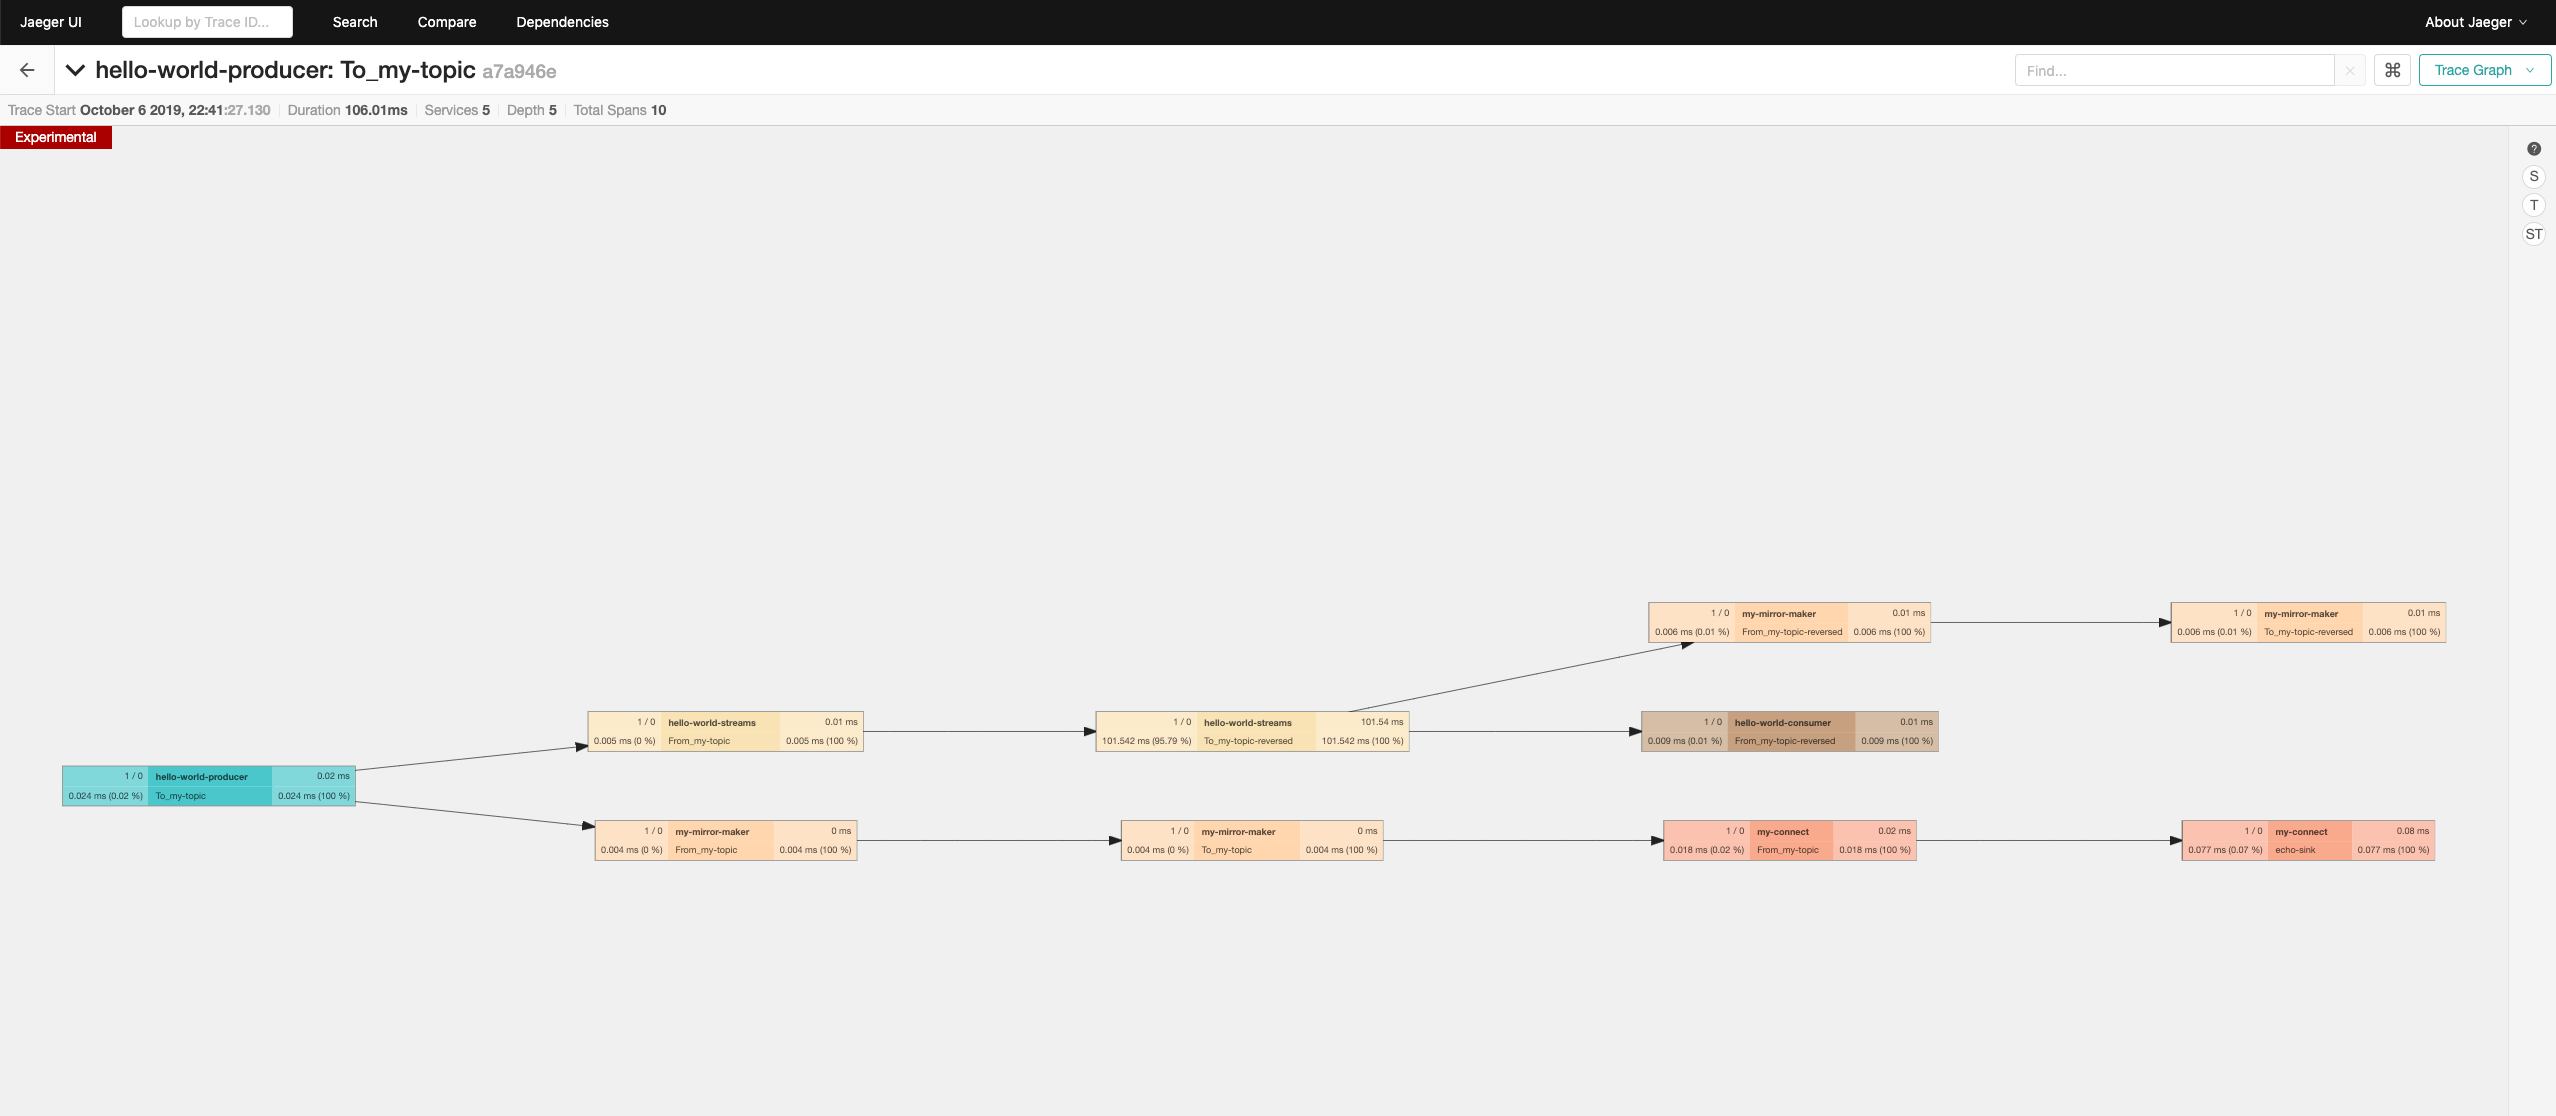
You can also switch to the trace graph, which shows the dependency between the different services which the message went through.
Mirror Maker
We can make this a bit more interesting by adding a second Kafka cluster and mirror the data from the first cluster to the second one. First we need to deploy a second Kafka cluster:
cat <<EOF | kubectl apply -f -
apiVersion: kafka.strimzi.io/v1beta1
kind: Kafka
metadata:
  name: my-second-cluster
spec:
  kafka:
    version: 2.3.0
    replicas: 3
    listeners:
      plain: {}
      tls: {}
    config:
      offsets.topic.replication.factor: 3
      transaction.state.log.replication.factor: 3
      transaction.state.log.min.isr: 2
      log.message.format.version: "2.3"
    storage:
      type: jbod
      volumes:
      - id: 0
        type: persistent-claim
        size: 100Gi
        deleteClaim: false
  zookeeper:
    replicas: 3
    storage:
      type: persistent-claim
      size: 100Gi
      deleteClaim: false
  entityOperator:
    topicOperator: {}
    userOperator: {}
EOF
And wait until it becomes ready:
kubectl wait kafka/my-second-cluster --for=condition=Ready --timeout=300s
Once the cluster is running, we can deploy Mirror Maker:
cat <<EOF | kubectl apply -f -
apiVersion: kafka.strimzi.io/v1beta1
kind: KafkaMirrorMaker
metadata:
  name: my-mirror-maker
spec:
  version: 2.3.0
  replicas: 1
  consumer:
    bootstrapServers: my-cluster-kafka-bootstrap:9092
    groupId: my-mirror-maker
  producer:
    bootstrapServers: my-second-cluster-kafka-bootstrap:9092
  whitelist: ".*"
  tracing:
    type: jaeger
  template:
    mirrorMakerContainer:
      env:
        - name: JAEGER_SERVICE_NAME
          value: my-mirror-maker
        - name: JAEGER_AGENT_HOST
          value: my-jaeger-agent
        - name: JAEGER_SAMPLER_TYPE
          value: const
        - name: JAEGER_SAMPLER_PARAM
          value: "1"
EOF
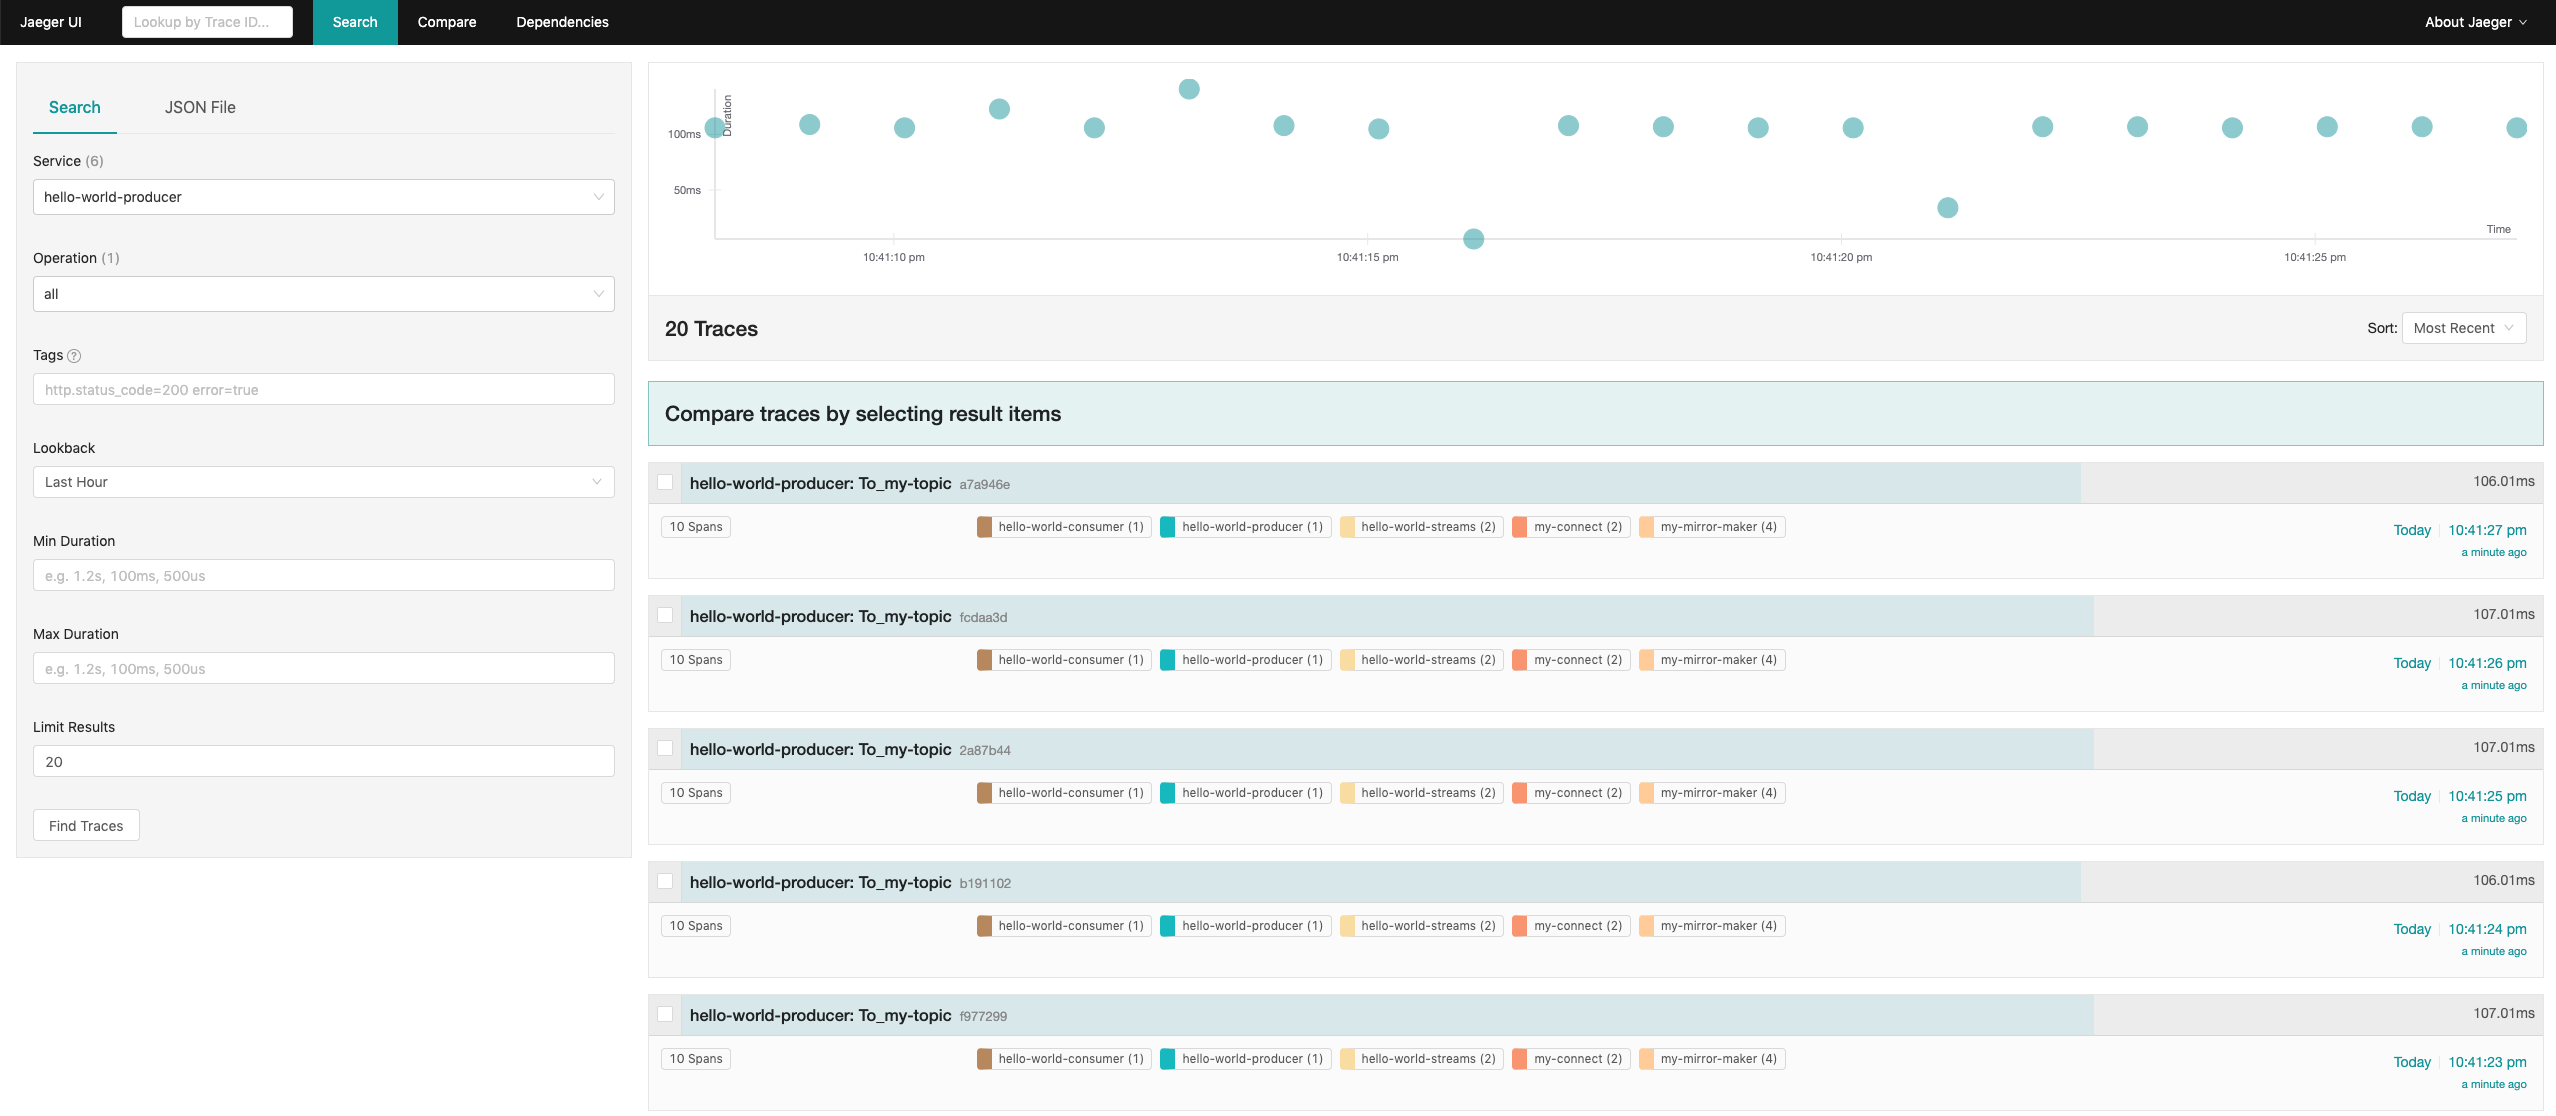
Once Mirror Maker deploys and starts mirroring the messages, you should see some additional spans in the Jaeger UI. Notice that since Mirror Maker mirrors both topics - the one produced by the original producer as well as the topics with the reversed texts - you can see Mirror Maker twice there. And because Mirror Maker always receives every message from the source cluster and produces it into the target cluster, there will be again two spans for each message.
Kafka Connect
Next, we can try to hook-up Kafka Connect instance to our second cluster:
cat <<EOF | kubectl apply -f -
apiVersion: kafka.strimzi.io/v1alpha1
kind: KafkaConnect
metadata:
  name: my-connect
  labels:
    app: my-connect
spec:
  image: scholzj/kafka:tracing-blog-post
  replicas: 1
  bootstrapServers: my-second-cluster-kafka-bootstrap:9092
  config:
    key.converter: org.apache.kafka.connect.storage.StringConverter
    value.converter: org.apache.kafka.connect.storage.StringConverter
    key.converter.schemas.enable: false
    value.converter.schemas.enable: false
  tracing:
    type: jaeger
  template:
    connectContainer:
      env:
        - name: JAEGER_SERVICE_NAME
          value: my-connect
        - name: JAEGER_AGENT_HOST
          value: my-jaeger-agent
        - name: JAEGER_SAMPLER_TYPE
          value: const
        - name: JAEGER_SAMPLER_PARAM
          value: "1"
EOF
As you can see, I use my own container image scholzj/kafka:tracing-blog-post for the Kafka Connect deployment.
This container image contains already my echo-sink connector plugin which I often use for testing while developing new Strimzi features.
This plugin simply receives messages from a topic and logs them in the Kafka Connect log.
This particular version of my Echo Sink connector has additional support for tracing.
It will extract the trace ids from the messages it receives and create a new tracing span called echo-sink which spans the logging of the message.
To create an instance of this connector, we have to execute into the Kafka Connect pod and run the following curl command:
curl -X POST -H "Content-Type: application/json" --data '{ "name": "echo-sink-test", "config": { "connector.class": "EchoSink", "tasks.max": "3", "topics": "my-topic", "level": "INFO" } }' http://localhost:8083/connectors
That should create the connector instance. And once you check the Kafka connect logs, you should see there messages like this:
2019-10-06 20:40:52,103 INFO Received message with key 'null' and value '"Hello world - 950"' (cz.scholz.kafka.connect.echosink.EchoSinkTask) [task-thread-echo-sink-test-0]
2019-10-06 20:40:53,103 INFO Received message with key 'null' and value '"Hello world - 951"' (cz.scholz.kafka.connect.echosink.EchoSinkTask) [task-thread-echo-sink-test-0]
2019-10-06 20:40:54,106 INFO Received message with key 'null' and value '"Hello world - 952"' (cz.scholz.kafka.connect.echosink.EchoSinkTask) [task-thread-echo-sink-test-0]
2019-10-06 20:40:55,106 INFO Received message with key 'null' and value '"Hello world - 953"' (cz.scholz.kafka.connect.echosink.EchoSinkTask) [task-thread-echo-sink-test-0]
2019-10-06 20:40:56,106 INFO Received message with key 'null' and value '"Hello world - 954"' (cz.scholz.kafka.connect.echosink.EchoSinkTask) [task-thread-echo-sink-test-0]
Checking the Jaeger UI, you should now see the spans from Kafka Connect (when it receives the message) and the Echo Sink connector when it logs the message. The following screenshots show what you should see at the end of our little demo.

Next steps
One of the Strimzi components where we are currently missing tracing support is our own Strimzi bridge. We plan to add tracing support there as well — hopefully in the next release. That will extend the scope of tracing to include HTTP clients as well as components using the Kafka protocol. You would be able to start tracing in your HTTP clients and use it through the Kafka landscape.
If you like Strimzi, star us on GitHub and follow us on Twitter to make sure you don’t miss any of our future blog posts!
Share this:
![]()
![]()
![]()
![]()
![]()