In our previous blog post we focused on tracing which was one of the new features in our 0.14.0 release. But tracing is not the only improvement to the monitoring capabilities we did in 0.14.0. We also have some significant improvements to Prometheus monitoring. Strimzi has supported Prometheus for Kafka metrics almost since the beginning. But in 0.14.0 we have made some major improvements by adding support for the Kafka Exporter tool. Kafka Exporter adds some additional metrics that are missing in Kafka brokers. Learn more about them in this blog post.
Prometheus monitoring
Prometheus is an open source monitoring solution which has become the de-facto standard for metrics and alerting in the cloud native world. Unlike many other monitoring systems, with Prometheus your applications do not have to push the metrics to Prometheus. Instead, Prometheus will scrape (collect) metrics from you applications and store them in its time-series database. The interface from which Prometheus scrapes these data is a simple HTTP endpoint providing a text output with the metrics. There are many tools and libraries which make it easy for you to create the Prometheus endpoint in your application. Check the Instrumenting section of the Prometheus documentation to learn more about how to expose Prometheus metrics from your application.
Once the metrics are stored in the database, you can query them using the PromQL query language. The PromQL language is an API which other applications can use to query the metrics. One of the tools supporting it is Grafana, which can be used to visualize the data from the Prometheus database.
Prometheus can also be used for alerting. You can configure rules which should trigger alerts. Prometheus will evaluate the rules against the metrics which it is scraping and when any of the rules is matched, it will send it to Alertmanager. Alertmanager will be then responsible for managing these alerts. It will handle duplicates, silencing, inhibition and aggregation of alerts and send out notification to your system of choice. You can have your alerts sent to many different notification channels such as emails, Slack, PagerDuty and more.
Apache Kafka and Prometheus
Apache Kafka doesn’t support Prometheus metrics natively by default. Like many JVM based applications it uses JMX (Java Management Extensions) for exposing metrics. But since our aim in the Strimzi project is to offer a Kubernetes-native experience when running Apache Kafka, we want to have the metrics exposed as a Prometheus endpoint. To help with that, we use the Prometheus JMX Exporter project which takes the JMX metrics and exposes them as Prometheus endpoint. Apart from integrating the JMX Exporter we also provide Grafana dashboards and sample Prometheus alerting rules which you can use and adapt to your own needs.
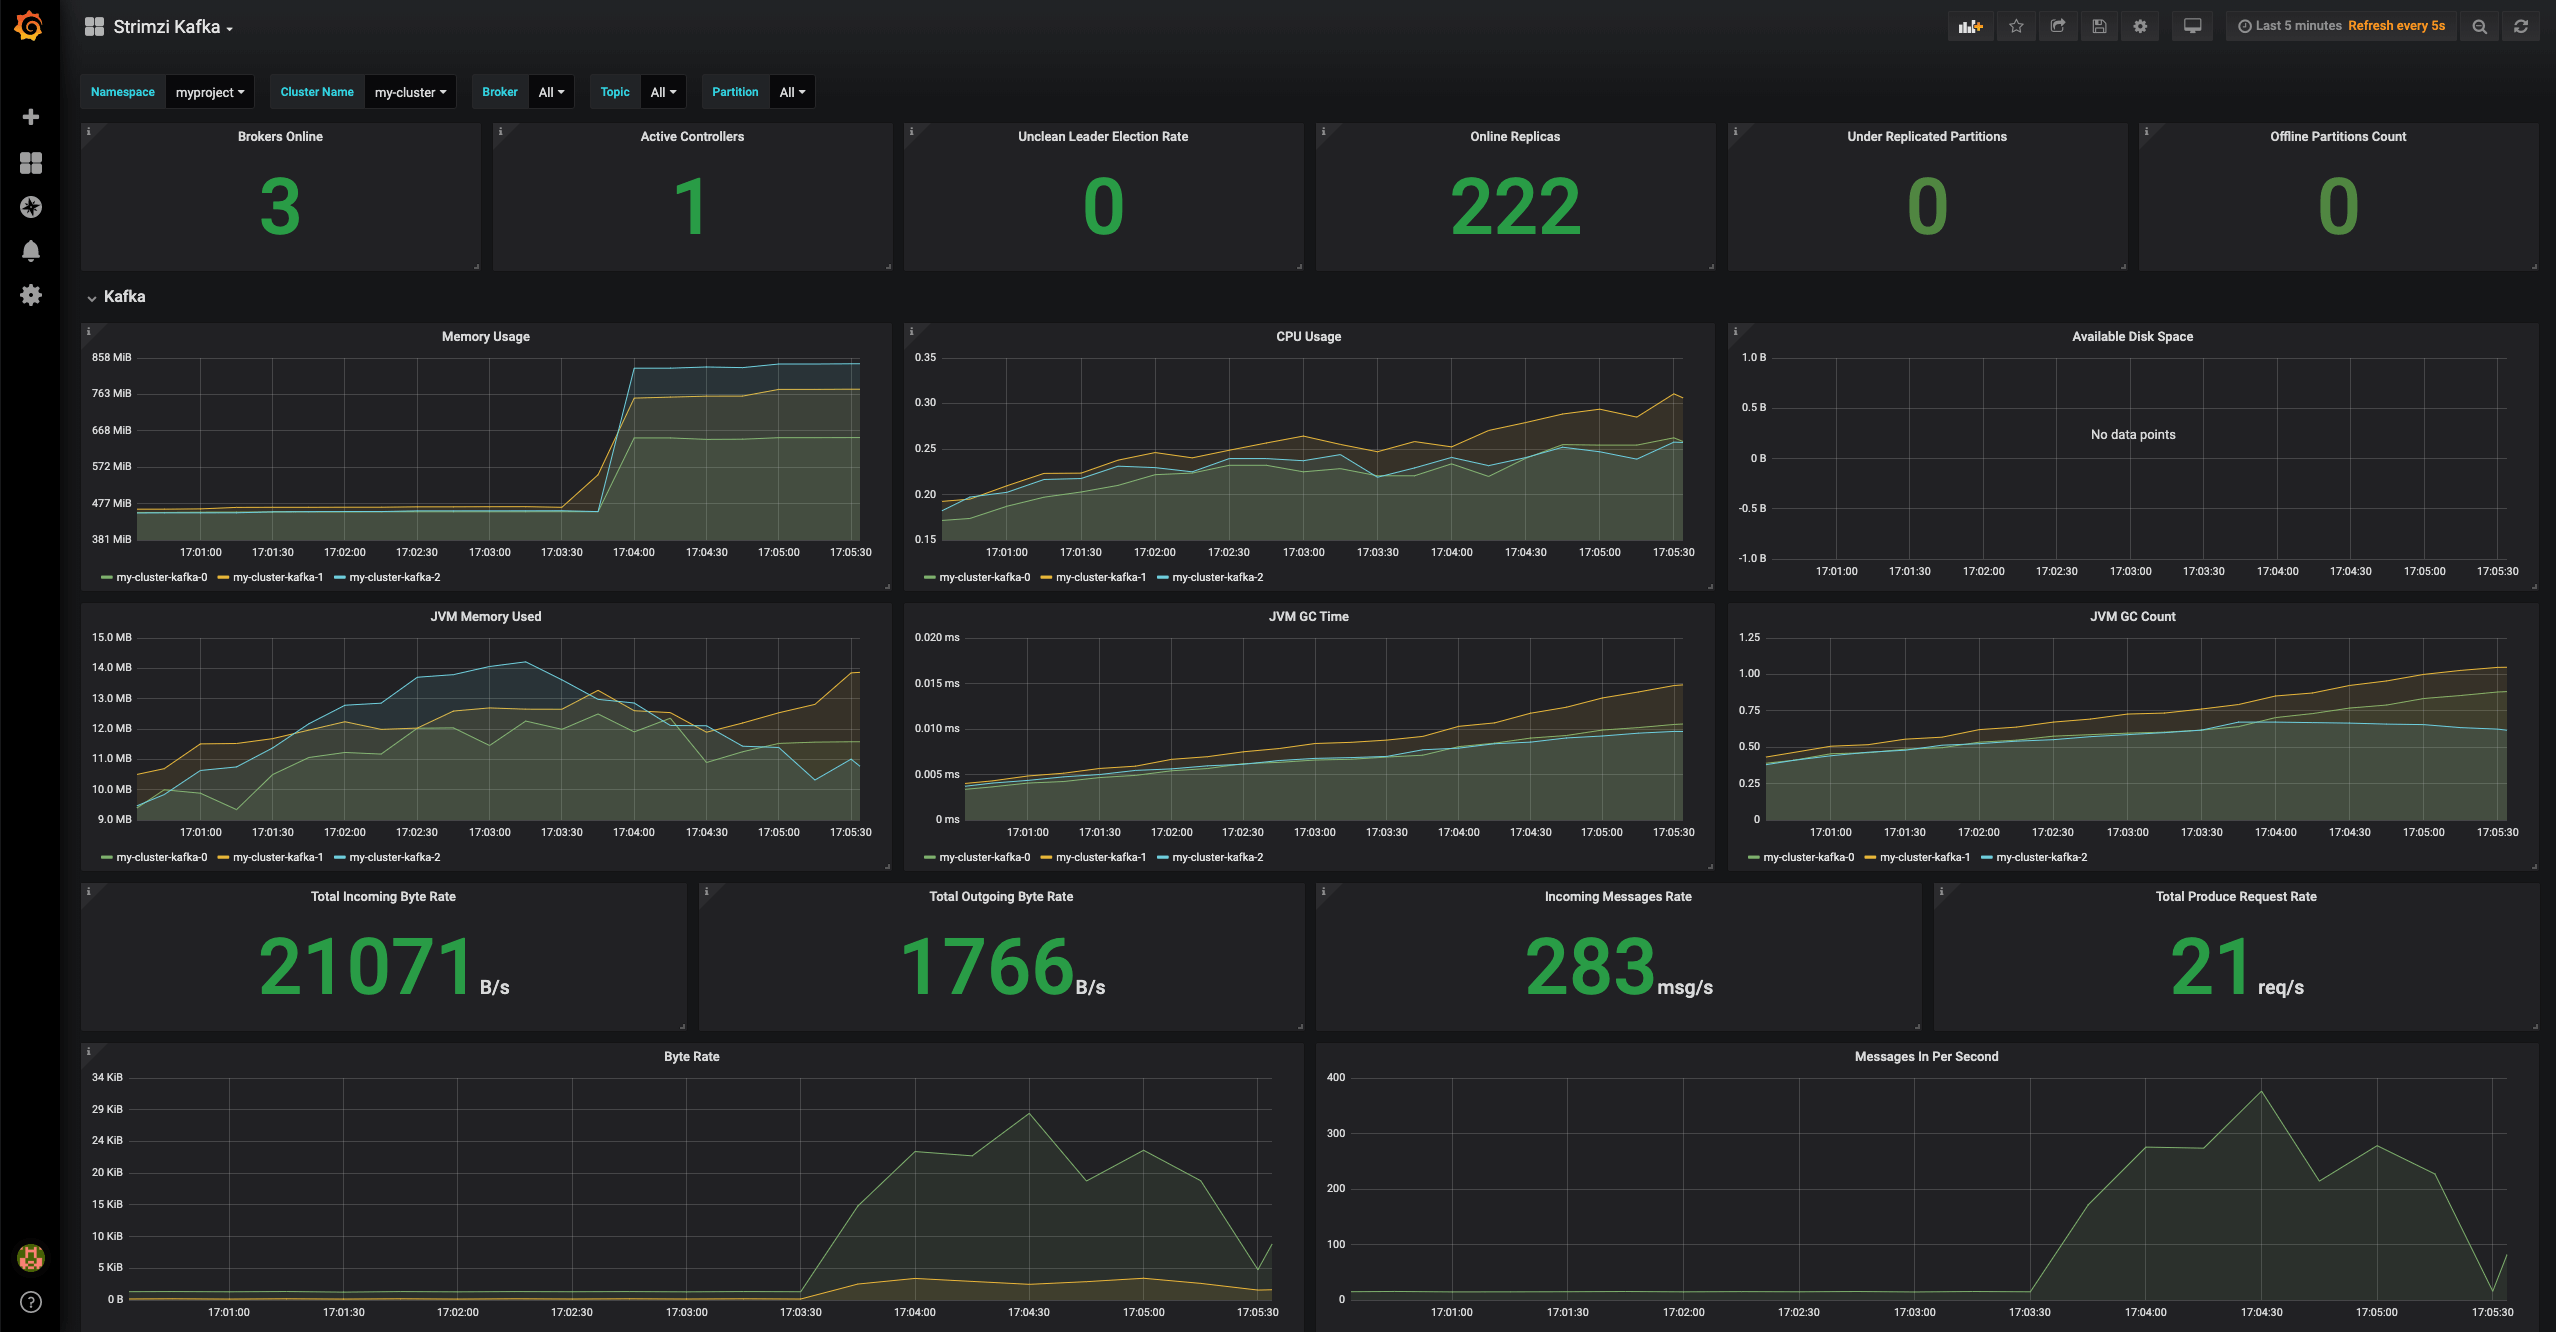
To enable the JMX Exporter in Strimzi, you have to specify the metrics section in the Strimzi Kafka, KafkaConnect and KafkaConnectS2I custom resources.
This section configures the JMX exporter and tells it how the JMX metrics should be converted to the Prometheus metrics.
There are different ways to configure the JMX Exporter.
And while you are of course free to configure it according to your needs, it is important to follow our configuration if you want to use our dashboards and alerting rules.
The Prometheus support, dashboards and sample alerting rules do not only work with Kafka brokers.
They also support Kafka Connect and Apache Zookeeper.
All the files needed for Prometheus monitoring can be found in the examples/metrics folder in our GitHub repository.
You can also follow our documentation which will not only help you with our dashboards but also with setting up Prometheus, Prometheus AlertManager and Grafana.
Kafka Exporter
So that explains Strimzi’s support for metrics, but how does the Kafka Exporter we mentioned fit in? Kafka brokers provide a lot of useful metrics related to the broker state, usage, and performance. But some important metrics are missing. For example it doesn’t provide any metrics about the consumer lag or information about topics. You can get this information through the Kafka command line tools or the Kafka Admin API. But not as a JMX or Prometheus metric.
Consumer lag in particular is very important because it allows you to monitor the delay between the offset consumed by your consumers and the offset of the most recently added messages. When the lag is growing, it indicates that the consumers are slower than the producers and they are falling behind. If your applications are supposed to work in near real-time, you will need to do something to rectify the situation.
Having the consumer lag in your Grafana dashboards and being able to configure alerts based on it will make it much easier to monitor your Kafka based applications. That is the reason why we added support for Kafka Exporter. Kafka Exporter is a great open source project from Daniel Qian and other contributors - thanks for all your work. Strimzi just integrates it into our own Kafka deployments. Kafka Exporter connects to Kafka as a client and collects different information about topics, partitions and consumer groups. It then exposes this information as a Prometheus metric endpoint.
Deploying Kafka Exporter with Strimzi is easy.
All you need to do is to add it into a Kafka custom resource:
apiVersion: kafka.strimzi.io/v1beta1
kind: Kafka
metadata:
  name: my-cluster
spec:
  # ...
  kafkaExporter: {}
Strimzi will create a new deployment with the Kafka Exporter and configure it to connect to the Kafka cluster. You do not need to create any certificates or configure where it should connect. But if you need, you can configure the consumer groups or the topics which it should monitor:
apiVersion: kafka.strimzi.io/v1beta1
kind: Kafka
metadata:
  name: my-cluster
spec:
  # ...
  kafkaExporter:
    topicRegex: "important-topic-.*"
    groupRegex: "important-group-.*"
You can find all the available configuration options in our API reference.
Kafka Exporter doesn’t only provide the consumer lag metric. It also provides a lot of additional details about consumer groups and topics.
- Information about message consumption rates.
- Latest offsets per consumer group.
- Latest and oldest offset for topics.
- Information about partitions which do not have their leader on the preferred node. All these metrics can be used in alerts and dashboards.
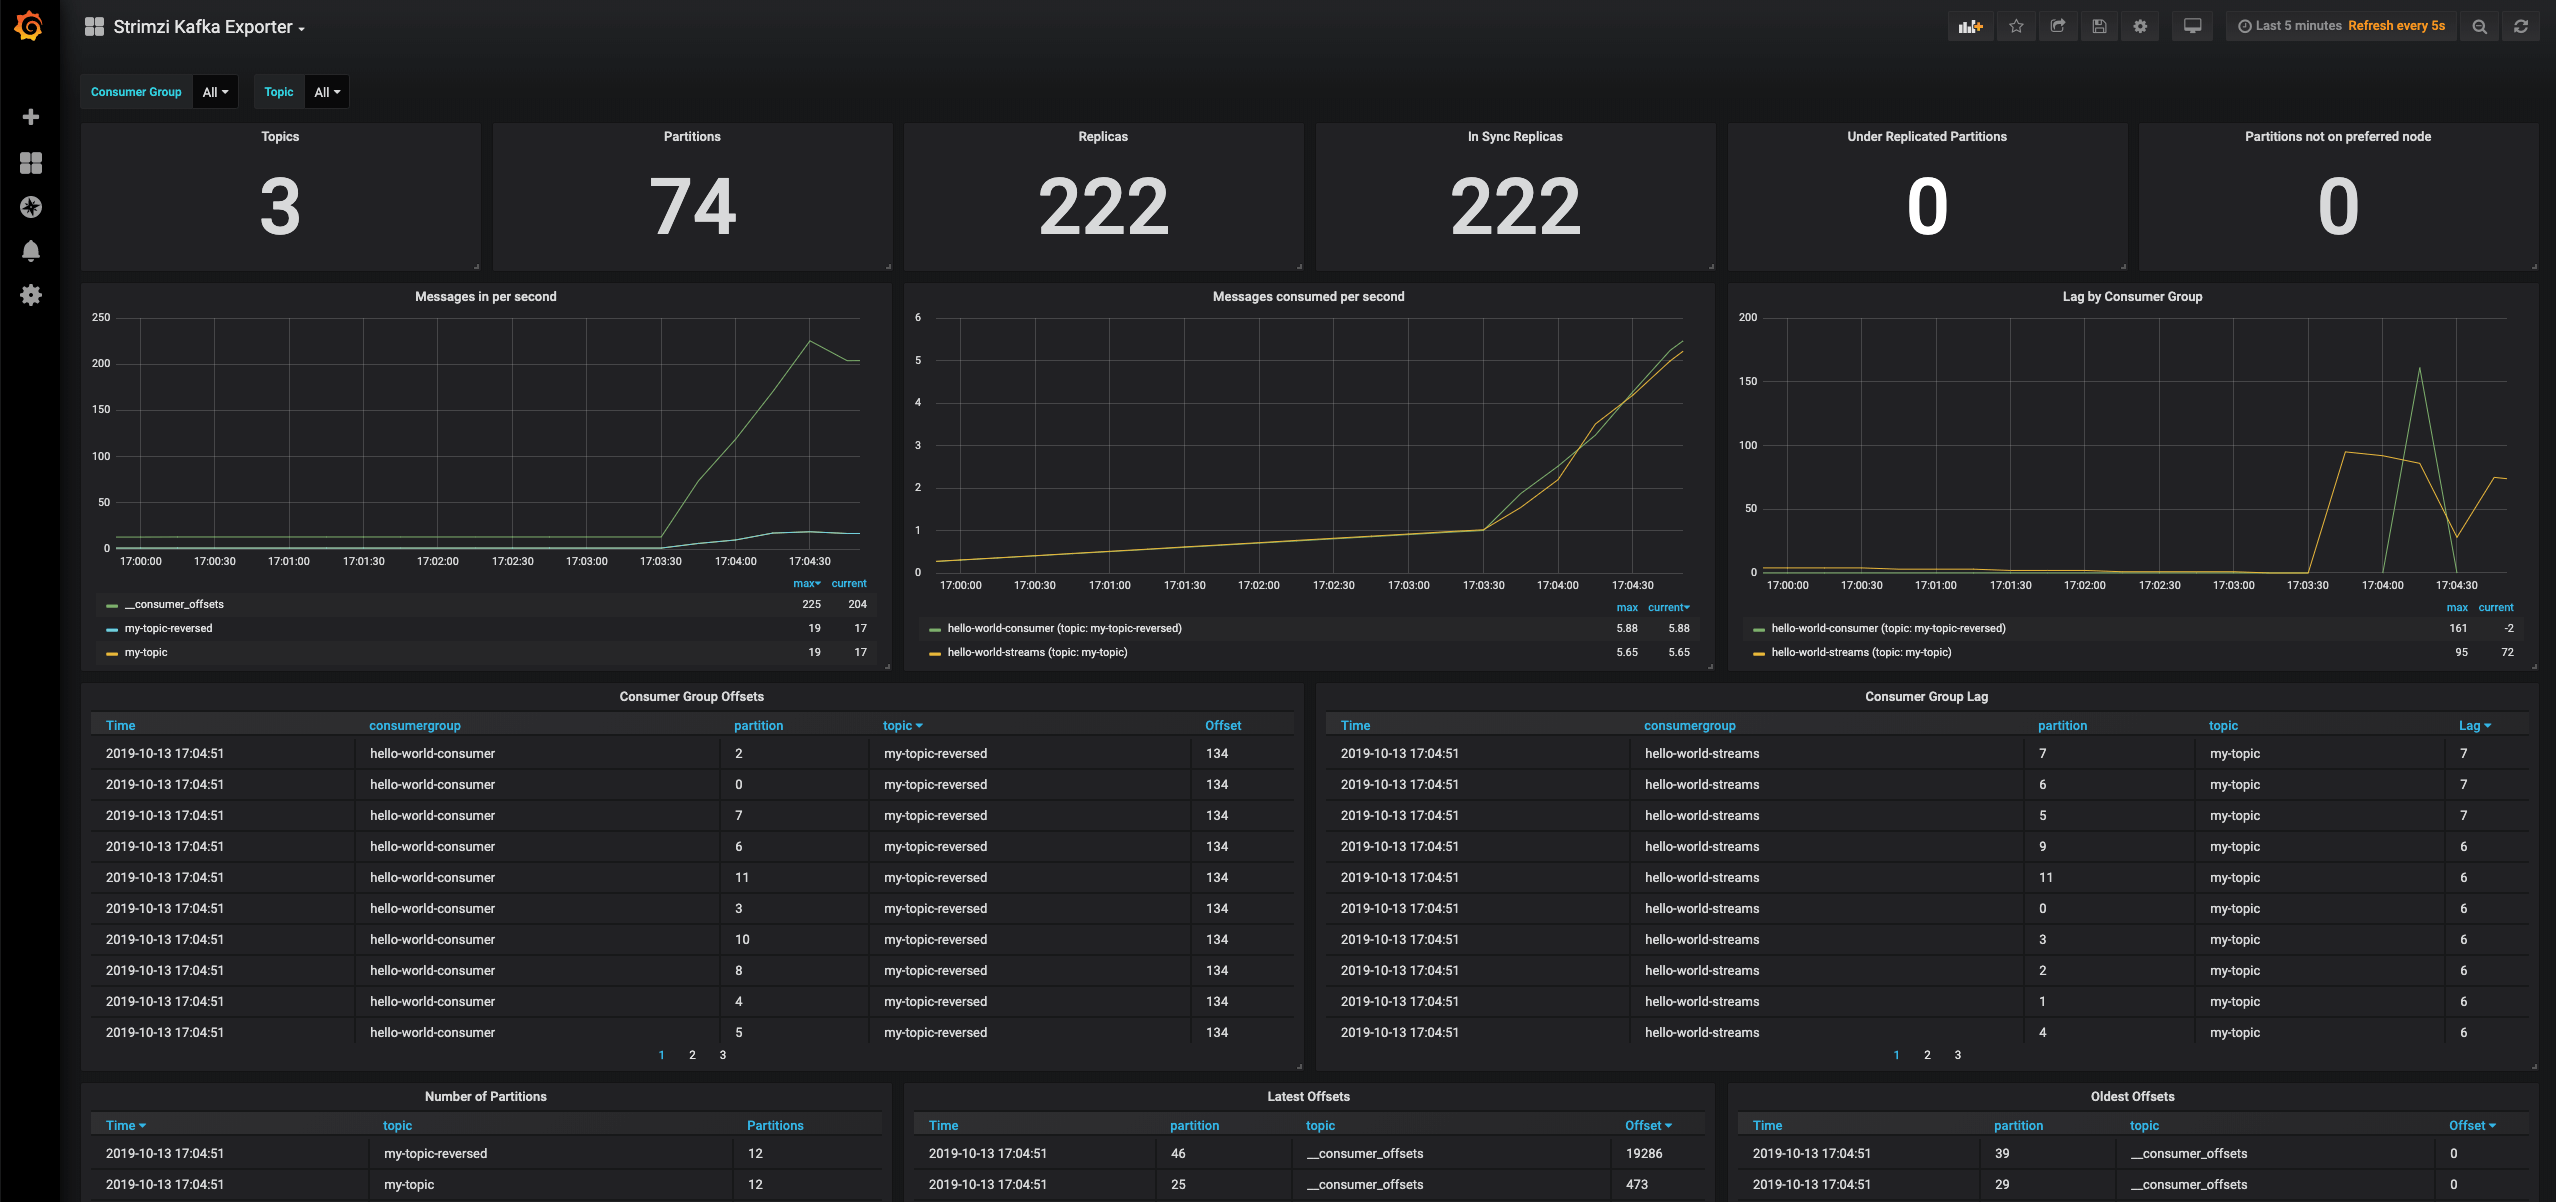
Once you have the Kafka Exporter deployed, you can start scraping the metrics it provides. We also provide a new Grafana dashboard and alert rules which work with the new metrics. In 0.14.0 the dashboard we have is fairly basic. In 0.15.0 we will release an improved Grafana dashboard which uses more of the different metrics provided by the Kafka Exporter. You can find the sample Prometheus Alerts and the Grafana dashboard on our GitHub.
Conclusion
It is important for us to provide production ready Kafka. And effective monitoring is a big part of that. Kafka Exporter is an important improvement to the monitoring capabilities of Strimzi. It gives our users consumer lag monitoring out of the box. If you like the features which Kafka Exporter provides, do not forget to go and give it a star on GitHub.
If you like Strimzi, star us on GitHub and follow us on Twitter to make sure you don’t miss any of our future blog posts!
Share this:
![]()
![]()
![]()
![]()
![]()