Apache Kafka behaves as a commit-log when it comes to dealing with storing records. Records are appended at the end of each log one after the other and each log is also split in segments. Segments help with deletion of older records, improving performance, and much more. So, the log is a logical sequence of records that’s composed of segments (files) and segments store a sub-sequence of records. Broker configuration allows you to tweak parameters related to logs. You can use configuration to control the rolling of segments, record retention, and so on.
Not everyone is aware of how these parameters have an impact on broker behavior.
For instance, they determine how long records are stored and made available to consumers.
In this blog post, we will dig more into how log segmentation and record retention impacts broker performance when your log cleanup policy is set to delete. When you know more about how it works, you might want to adjust your log configuration.
Log retention is handled differently when you use a
compactpolicy instead of adeletepolicy. Using keys to identify messages, Kafka compaction keeps the latest message (with the highest offset) for a specific message key. Earlier messages that have the same key are discarded. You can read more on compaction in the Strimzi documentation for removing log data with cleanup policies.
The topic partition structure on the disk
An Apache Kafka topic is split into partitions where records are appended to. Each partition can be defined as a unit of work, rather than unit of storage, because it is used by clients to exchange records. A partition is further split into segments, which are the actual files on the disk. Splitting into segments can really help with performance. When records are deleted on disk or a consumer starts to consume from a specific offset, a big, unsegmented file is slower and more error prone.
Looking at the broker disk, each topic partition is a directory containing the corresponding segment files and other files. Using the Strimzi Canary component with its producer and consumer as an example, here’s a sample of what the directory looks like.
├── __strimzi_canary-0
│   ├── 00000000000000000000.index
│   ├── 00000000000000000000.log
│   ├── 00000000000000000000.timeindex
│   ├── 00000000000000000109.index
│   ├── 00000000000000000109.log
│   ├── 00000000000000000109.snapshot
│   ├── 00000000000000000109.timeindex
The example shows partition 0 of the __strimzi_canary topic used by the Strimzi Canary component. The directory contains the following files:
- The
.logfile is an actual segment containing records up to a specific offset. The name of the file defines the starting offset of the records in that log. - The
.indexfile contains an index that maps a logical offset (in effect the record’s id) to the byte offset of the record within the.logfile. It is used for accessing records at specified offsets in the log without having to scan the whole.logfile. - The
.timeindexfile is another index used for accessing records by timestamp in the log. - The
.snapshotfile contains a snapshot of the producer state regarding sequence IDs used to avoid duplicate records. It is used when, after a new leader is elected, the preferred one comes back and needs such a state in order to become leader again.
Continuing with the Strimzi Canary component as an example, here’s a more detailed view of the previous topic partition directory.
drwxrwxr-x.  2 ppatiern ppatiern      200 Nov 14 16:33 .
drwxrwxr-x. 55 ppatiern ppatiern     1220 Nov 14 16:33 ..
-rw-rw-r--.  1 ppatiern ppatiern       24 Nov 14 16:33 00000000000000000000.index
-rw-rw-r--.  1 ppatiern ppatiern    16314 Nov 14 16:33 00000000000000000000.log
-rw-rw-r--.  1 ppatiern ppatiern       48 Nov 14 16:33 00000000000000000000.timeindex
-rw-rw-r--.  1 ppatiern ppatiern 10485760 Nov 14 16:33 00000000000000000109.index
-rw-rw-r--.  1 ppatiern ppatiern      450 Nov 14 16:33 00000000000000000109.log
-rw-rw-r--.  1 ppatiern ppatiern       10 Nov 14 16:33 00000000000000000109.snapshot
-rw-rw-r--.  1 ppatiern ppatiern 10485756 Nov 14 16:33 00000000000000000109.timeindex
-rw-rw-r--.  1 ppatiern ppatiern        8 Nov 14 16:24 leader-epoch-checkpoint
From the output, you can see that the first log segment 00000000000000000000.log contains records from offset 0 to offset 108.
The second segment 00000000000000000109.log contains records starting from offset 109 and is called the active segment.
The active segment is the only file open for read and write operations. It is the segment where new incoming records are appended. A partition only has one active segment. Non-active segments are read-only, and are accessed by consumers reading older records. When the active segment becomes full it is rolled, which means it is closed and re-opened in read-only mode. A new segment file is created and opened in read-write mode, becoming the active segment.
From the example, you can see that the old segment was closed when it reached 16314 byes in size. This is because of the Canary topic configuration segment.bytes=16384, which sets the maximum size. We’ll talk about this configuration later.
150 byes is the size of every single record sent by the Canary component. So, each segment will contain 109 records. 109 * 150 bytes = 16350 bytes, which is close to the maximum segment size.

It is also possible to dump the records from a log segment by using the DumpLogSegments tool provided by the Apache Kafka distribution.
Running the following command shows the records inside the specified segment log.
./bin/kafka-run-class.sh kafka.tools.DumpLogSegments --deep-iteration --print-data-log --files /tmp/kafka-logs-0/__strimzi_canary-0/00000000000000000000.log
Dumping /tmp/kafka-logs-0/__strimzi_canary-0/00000000000000000000.log
Starting offset: 0
baseOffset: 0 lastOffset: 0 count: 1 baseSequence: 0 lastSequence: 0 producerId: -1 producerEpoch: -1 partitionLeaderEpoch: 0 isTransactional: false isControl: false position: 0 CreateTime: 1639132508991 size: 148 magic: 2 compresscodec: NONE crc: 2142666254 isvalid: true
| offset: 0 CreateTime: 1639132508991 keysize: -1 valuesize: 78 sequence: 0 headerKeys: [] payload: {"producerId":"strimzi-canary-client","messageId":1,"timestamp":1639132508991}
baseOffset: 1 lastOffset: 1 count: 1 baseSequence: 0 lastSequence: 0 producerId: -1 producerEpoch: -1 partitionLeaderEpoch: 0 isTransactional: false isControl: false position: 148 CreateTime: 1639132514555 size: 148 magic: 2 compresscodec: NONE crc: 1895373344 isvalid: true
| offset: 1 CreateTime: 1639132514555 keysize: -1 valuesize: 78 sequence: 0 headerKeys: [] payload: {"producerId":"strimzi-canary-client","messageId":4,"timestamp":1639132514555}
baseOffset: 2 lastOffset: 2 count: 1 baseSequence: 0 lastSequence: 0 producerId: -1 producerEpoch: -1 partitionLeaderEpoch: 0 isTransactional: false isControl: false position: 296 CreateTime: 1639132519561 size: 148 magic: 2 compresscodec: NONE crc: 1097825866 isvalid: true
..
..
..
..
| offset: 107 CreateTime: 1639133044553 keysize: -1 valuesize: 80 sequence: 0 headerKeys: [] payload: {"producerId":"strimzi-canary-client","messageId":322,"timestamp":1639133044553}
baseOffset: 108 lastOffset: 108 count: 1 baseSequence: 0 lastSequence: 0 producerId: -1 producerEpoch: -1 partitionLeaderEpoch: 0 isTransactional: false isControl: false position: 16164 CreateTime: 1639133049552 size: 150 magic: 2 compresscodec: NONE crc: 1749984078 isvalid: true
| offset: 108 CreateTime: 1639133049552 keysize: -1 valuesize: 80 sequence: 0 headerKeys: [] payload: {"producerId":"strimzi-canary-client","messageId":325,"timestamp":1639133049552}
From the example, you can see the records from offset 0 to 108 are stored in the 00000000000000000000.log segment.
How does indexing work within a partition?
As mentioned previously, the .index file contains an index that maps the logical offset to the byte offset of the record within the .log file.
You might expect that this mapping is available for each record, but it doesn’t work this way.
Let’s consider the record sent by the Canary component, which is around 150 bytes in size.
In the following diagram, you can see that for 85 records stored in the log file, the corresponding index has just 3 entries.
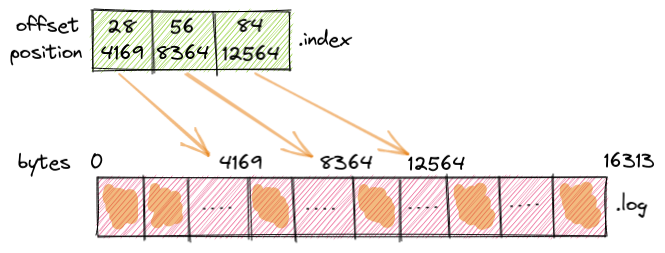
The record with offset 28 is at byte offset 4169 in the log file, the record with offset 56 is at byte offset 8364, and so on.
By using the DumpLogSegments tool, it is possible to dump the .index file content.
bin/kafka-run-class.sh kafka.tools.DumpLogSegments --deep-iteration --print-data-log --files /tmp/kafka-logs-0/__strimzi_canary-0/00000000000000000000.index
Dumping /tmp/kafka-logs-0/__strimzi_canary-0/00000000000000000000.index
offset: 28 position: 4169
offset: 56 position: 8364
offset: 84 position: 12564
How these entries are added inside the index file is defined by the log.index.interval.bytes parameter, which is 4096 bytes by default.
It means that for every 4096 bytes of records added in the log file, an entry is added in the corresponding index file.
Each entry is 8 bytes in size, 4 for the offset and 4 for the bytes position in the segment.
In this example, we have a new index entry added every 28 records because 28 * 150 = 4200.
If a consumer wants to read starting at a specific offset, a search for the record is made as follows:
- Search for an
.indexfile based on its name, which follows the same patterns as the corresponding.logfile. The file contains the starting offset of the records indexed by that index. - Search for an entry in the
.indexfile where the requested offset falls. - Use the corresponding bytes offset to access the
.logfile and search for the offset that the consumer wants to start from.
The log.index.interval.bytes parameter can be tuned for faster searches of records despite the index file growing or vice versa.
If you set log.index.interval.bytes to less than the default 4096 bytes, you will have more entries in the index for a more fine-grained search. But more entries will cause the file to increase in size faster as well.
If you set the parameter above the default 4096 bytes, you will have less entries in the index, which will slow down the search. This also means that the file size will increase in size more slowly too.
Apache Kafka also allows you to start consuming records based on a timestamp. This is when .timeindex comes into the picture.
Each entry in the .timeindex file defines a timestamp and offset pair, which points to the corresponding .index file entry.
In the following diagram, you can see that the records from timestamp 1638100314372 start at offset 28, the records from 1638100454372 start at offset 56, and so on.
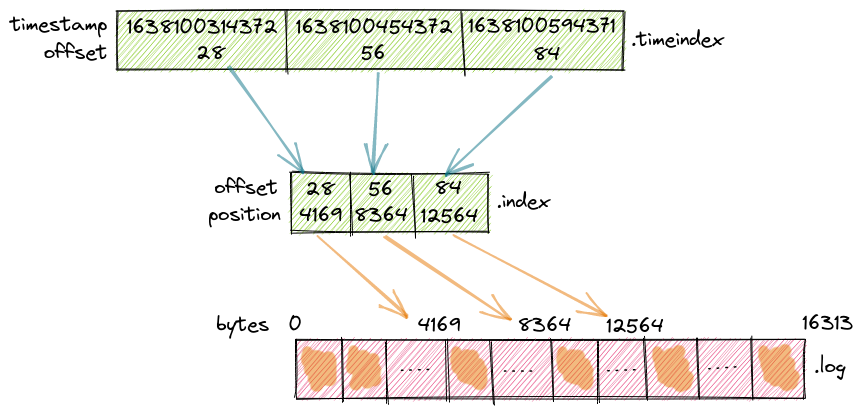
Each entry is 12 bytes in size, 8 for the timestamp and 4 for the offset.
It reflects exactly how the Strimzi Canary component is producing records, because it’s sending one record every 5 seconds. 28 records would be sent in 140 seconds (28 x 5), which is exactly the difference between the timestamps: 1638100454372 - 1638100314372 = 140000 milliseconds.
By using the DumpLogSegments tool, it is possible to dump the .timeindex file content.
bin/kafka-run-class.sh kafka.tools.DumpLogSegments --deep-iteration --print-data-log --files /tmp/kafka-logs-0/__strimzi_canary-0/00000000000000000000.timeindex
Dumping /tmp/kafka-logs-0/__strimzi_canary-0/00000000000000000000.timeindex
timestamp: 1638100314372 offset: 28
timestamp: 1638100454372 offset: 56
timestamp: 1638100594371 offset: 84
Let’s talk about rolling segments
A new segment is rolled when some specific conditions are met.
One condition is when the maximum segment size is reached, as specified by the configuration parameter log.segment.bytes (1 GiB by default).
Another condition is based on the log.roll.ms or log.roll.hours (7 days by default) parameters. In this case, the segment is rolled when the configured time since the producer timestamp of the first record in the segment (or since the creation time if there is no timestamp) has elapsed.
The first condition that is met will trigger the rolling of a new segment.
It is also worth noticing that, as a not so usual use case, the producer timestamps in the records could be not ordered, so not having the older record as the first one, due to retries or the specific business logic of the producer.
Another useful parameter is log.roll.jitter.ms, which sets a maximum jitter when it’s time to roll a segment,. Jitters are time intervals to avoid many segments being rolled at same time causing high contention on the disk.
A jitter is randomly generated for each segment.
The above conditions, by size or time, are the well known ones but not everyone knows that there is a third condition.
A segment is rolled even when the corresponding index (or timeindex) is full.
The index and timeindex share the same maximum size, which is defined by the log.index.size.max.bytes configuration parameter, and it is 10 MB by default.
Let’s consider the default log segment maximum size, which is 1 GiB.
We know that because log.index.interval.bytes is 4096 bytes by default, an entry is added in the index every 4096 bytes of records.
It means that for a 1 GiB segment size, 1 GiB / 4096 bytes = 262144 entries are added to the index. This equals 2 MB of index (262144 * 8 bytes).
The default index size of 10 MB is enough to handle a segment size of 5 GiB.
Reducing the index size or increasing the segment size will mean a new segment is rolled when the index is full and not when the requested segment size is reached.
So, setting a segment size larger than 5 GiB without increasing the index size is useless, because the broker will roll a new segment when the index is full.
By increasing the segment size over 5 GiB, you would also need to increase the index file size as well. Likewise, if you decide to reduce the index file size, it is possible that you might want to decrease the segment size proportionately.
The timeindex might also need attention. Because each timeindex entry is 1.5x bigger than an entry in the index (12 bytes versus 8 bytes), it can fill up earlier and cause a new segment to be rolled.
To show how the index and timeindex files size have an impact on rolling a new log segment, let’s consider a cluster with log.index.interval.bytes=150 and log.index.size.max.bytes=300 using the Strimzi Canary to produce and consume records with the usual configuration retention.ms=600000;segment.bytes=16384.
Because the Strimzi Canary records are close to 150 bytes in size, we would expect the index file to be filled with one entry every two records.
With the maximum size set at 300 bytes, we would have around 300 / 8 = 37 entries in the index file and around 300 / 12 = 25 entries in the timeindex file.
By running the Strimzi Canary for a while we have the following output:
-rw-rw-r--.  1 ppatiern ppatiern  192 Dec 10 16:23 00000000000000000000.index
-rw-rw-r--.  1 ppatiern ppatiern 7314 Dec 10 16:23 00000000000000000000.log
-rw-rw-r--.  1 ppatiern ppatiern  288 Dec 10 16:23 00000000000000000000.timeindex
-rw-rw-r--.  1 ppatiern ppatiern  296 Dec 10 16:23 00000000000000000049.index
-rw-rw-r--.  1 ppatiern ppatiern 4500 Dec 10 16:26 00000000000000000049.log
-rw-rw-r--.  1 ppatiern ppatiern   10 Dec 10 16:23 00000000000000000049.snapshot
-rw-rw-r--.  1 ppatiern ppatiern  300 Dec 10 16:23 00000000000000000049.timeindex
From the example, a new segment was rolled when the active one was still 7314 byes, not reaching the configured 16384 bytes. At the same time, the index reached 192 bytes in size, so actually having 192 / 8 = 24 entries and not the expected 37. The reason is because the timeindex reached the limit of 300 bytes first. It is 288 bytes containing 288 / 12 = 24 entries – the same number as the corresponding index.
You can set these parameters at the broker level, but they can also be overridden at the topic level.
How long my records are retained? Longer than you expect!
When managing your records, an important aspect is how long they’re retained before they’re deleted.
This is configurable in terms of size and duration. You can specify the maximum number of bytes to retain by using the log.retention.bytes parameter. If you want to set a retention period, you can use the log.retention.ms, log.retention.minutes, or log.retention.hours (7 days by default) parameters.
As with the parameters that control when a segment is rolled, the first condition that is met will cause the deletion of older records from the disk.
These parameters can be also be set at broker level and overridden at the topic level.
Suppose you configure the Strimzi canary topic by specifying a retention time of 600000 ms (10 mins) and a segment size of 16384 bytes, using the TOPIC_CONFIG environment variable set as retention.ms=600000;segment.bytes=16384.
With this configuration, the expection is that a new segment is rolled every time the current active one reaches 16384 bytes in size. This might not always happen. If the next record cannot be stored in the active segment because it would exceed the maximum segment size, a new segment is rolled earlier. Canary records being around 150 bytes in size, the expectation is that each segment can store about 16384 / 150 = 109 records before it is closed. Assuming that Canary is configured to produce records every 5 seconds, a segment is filled in 109 * 5 = 545 seconds. In other words, a new segment is rolled every 9 minutes.
Regarding records retention, the expectation would be that the records are retained for 10 minutes before they are deleted. But this isn’t actually so simple. What’s the minimum and maximum time after appending a record that we might still be able to read it?
A segment, together with the records it contains, can be deleted only when it is closed. This means that if the producer is pretty slow and the maximum size of 16384 bytes is not reached within the 10 minutes, older records won’t be deleted. Retention is therefore higher than what it’s meant to be.
Even if the active segment is filled quickly, the retention time is evaluated starting from the last record appended to the segment before it is closed. The latest record is retained for the 10 minutes we want, but the first records in the segment are retained for longer. Of course, this depends how quickly the segment was filled and how much time passed between the first record and the last one.
In our Canary example, the segment takes 9 minutes to be filled and closed. When the last record arrives, the first one in the segment is already 9 minutes old. While waiting for the 10 minutes retention since the last record arrived, the first record “should be” deleted after 19 minutes.
Anyway, even when we think that finally the retention time is evaluated after the last record, it could be still there!
The reason is related to an Apache Kafka thread that runs periodically on the broker to clean records and check which closed segments can be deleted. You can configure the period for this thread to run, which defaults to 5 minutes, using the log.retention.check.interval.ms parameter.
Depending on when the last record is appended and a segment is closed, periodic checks for deletion might contribute to missing the 10-minute deadline of the retention period. The closed segment might be deleted on the next check with up to almost 5 minutes delay.
In our example, it might be that the first record in the segment could live up to almost 24 minutes!
Assuming that at some point the clean thread runs, and verifies that a closed segment can be deleted. It adds a .deleted extension to the corresponding files, but doesn’t actually delete the segment from the file system.
The log.segment.delete.delay.ms broker parameter defines when the file will actually be removed from the file system when it’s marked as “deleted” (1 minute by default).
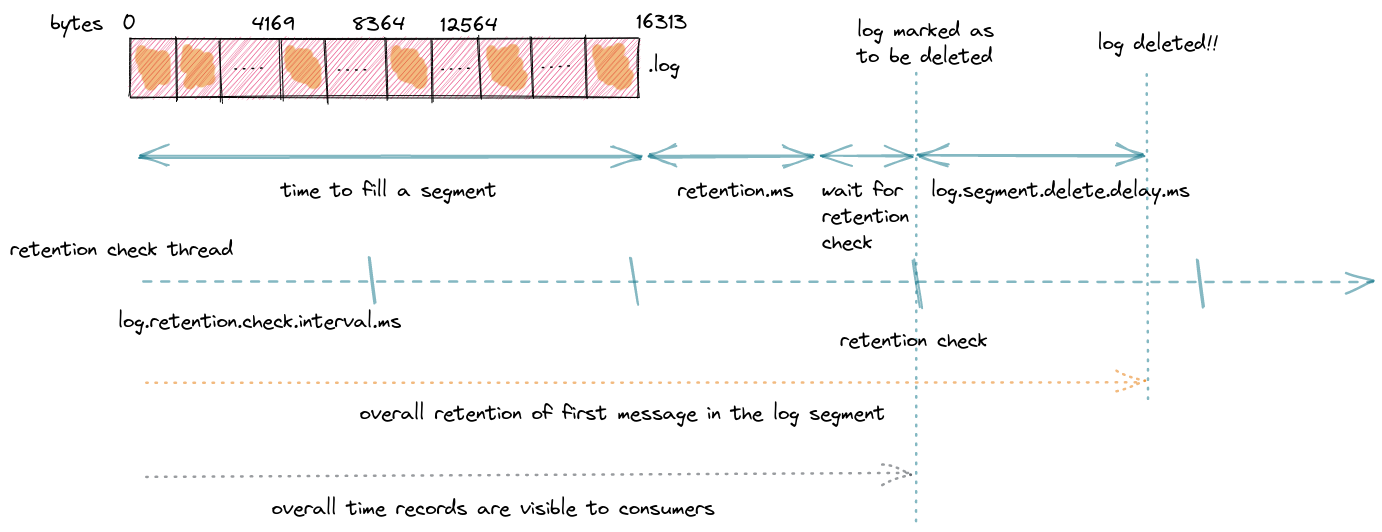
Returning to the Canary example again, and assuming the delay on deletion, the first record in our segment is still live after 25 minutes! It is much longer than the 10 minutes expectation, isn’t it?
As you can see, it is clear that the retention mechanism doesn’t really match the initial expectation.
In reality, a record could live even longer than our 10 minutes depending on the configuration and internal mechanics of the broker.
The usual retention limits set by using log.retention.ms defines a kind of lower bound. Kafka guarantees it will not delete any records that have an age less than the one specified, but any older records might be deleted at any time in the future depending on the settings.
It is also worth mentioning the impact on the consumer side. Consumers get records from closed segments but not from deleted ones, even if they are just marked as “deleted” but not actually removed from the file system. This is true even when a consumer starts to read the partition from the beginning. Longer retention won’t have a direct impact on the consumers, but more on the disk usage.
Conclusion
Understanding how the broker stores partitions and corresponding records on the disk is really important. Configuration parameters can have a surprisingly big influence on how long your data is retained. Learning about these parameters and how you can adjust them gives you a lot more control on how you handle your data.
Share this:
![]()
![]()
![]()
![]()
![]()