Following our popular and evergreen posts on fine-tuning producers and consumers, we complete our Kafka optimization trilogy with this post on getting started with broker configuration.
In terms of the options you can use to configure your brokers, there are countless permutations. We’ve reduced and refined the options and present here what’s commonly configured to get the most out of Kafka brokers.
And when we say brokers, we also include topics.
Some broker options provide defaults which can be overridden at the topic level, such as setting the maximum batch size for topics with message.max.bytes.
Basic broker configuration
A basic broker configuration might look something like this. You’ll see settings for topics, threads and logs.
# ...
num.partitions=1
default.replication.factor=3
offsets.topic.replication.factor=3
transaction.state.log.replication.factor=3
transaction.state.log.min.isr=1
log.retention.hours=168
log.segment.bytes=1073741824
log.retention.check.interval.ms=300000
num.network.threads=3
num.io.threads=8
num.recovery.threads.per.data.dir=1
socket.send.buffer.bytes=102400
socket.receive.buffer.bytes=102400
socket.request.max.bytes=104857600
group.initial.rebalance.delay.ms=0
zookeeper.connection.timeout.ms=6000
# ...
In Strimzi, you configure these settings through the config property of the Kafka custom resource.
In this post, we suggest what else you might add to optimize your Kafka brokers. Where example values are shown for properties, this is usually the default — adjust accordingly.
Some properties are managed directly by Strimzi, such as
broker.id. These properties are ignored if they are added to theconfigspecification.
Replicating topics for high availability
When you configure topics, the number of partitions, minimum number of in-sync replicas, and partition replication factor are typically set at the topic level.
You can use Strimzi’s KafkaTopic to do this.
You can also set these properties at the broker level too. In which case, the defaults are applied to topics that do not have these properties set explicitly, including automatically-created topics.
# ...
num.partitions=1
default.replication.factor=3
min.insync.replicas=2
# ...
High availability environments require a replication factor of at least 3 for topics and a minimum number of in-sync replicas as 1 less than the replication factor.
For increased data durability, set min.insync.replicas in your topic configuration and message delivery acknowledgments using acks=all in your producer configuration.
Use the replica.fetch.max.bytes property to set a maximum size for the messages fetched by each follower that replicates the data from a leader partition.
Base the value on the average message size and throughput. When considering the total memory allocation required for read/write buffering, the memory available must also be able to accommodate the maximum replicated message size when multiplied by all followers.
# ...
replica.fetch.max.bytes=1048576
# ...
The importance of Kafka’s topic replication mechanism cannot be overstated. Topic replication is central to Kafka’s reliability and data durability. Using replication, a failed broker can recover from in-sync replicas on other brokers. We’ll go into more detail about leaders, followers and in-sync replicas when discussing partition rebalancing for availability.
Creating and deleting topics
The auto.create.topics.enable property is enabled by default so that topics are created when needed by a producer or consumer. It’s usually disabled in production as Kafka users tend to prefer applying more control over topic creation.
If you are using automatic topic creation, you can set the default number of partitions for topics using num.partitions. Use it with the default.replication.factor property. In this case, you might want to set the replication factor to at least three replicas so that data is more durable by default.
The delete.topic.enable property is enabled by default to allow topics to be deleted. Kafka users normally disable this property in production too. This time you’re making sure that data is not accidentally lost, although you can temporarily enable the property to delete topics if circumstances demand it.
# ...
auto.create.topics.enable=false
delete.topic.enable=true
# ...
You cannot delete topics with the
KafkaTopicresource if thedelete.topic.enableproperty is set to false.
Internal topic settings for transactions and commits
Pay attention to the configuration requirements for internal Kafka topics.
If you are using transactions to enable atomic writes to partitions from producers, the internal __transaction_state topic used in the process requires a minimum of three brokers with the default settings.
# ...
transaction.state.log.replication.factor=3
transaction.state.log.min.isr=2
# ...
The __consumer_offsets topic, which stores partition offset commits, has default settings for the number of partitions and replication factor.
# ...
offsets.topic.num.partitions=50
offsets.topic.replication.factor=3
offsets.commit.required.acks=-1
# ...
WARNING: Do not reduce these settings in production.
Improving request handling throughput by increasing I/O threads
Network threads (num.network.threads) handle requests to the Kafka cluster, such as produce and fetch requests from client applications.
Adjust the number of network threads to reflect the replication factor and the levels of activity from client producers and consumers interacting with the Kafka cluster. To reduce congestion and regulate the request traffic, you can use queued.max.requests to limit the number of requests allowed in the request queue before the network thread is blocked.
Kafka broker metrics can help with working out the number of threads required. For example, metrics for the average time network threads are idle (
kafka.network:type=SocketServer,name=NetworkProcessorAvgIdlePercent) indicate the percentage of resources used. If there is 0% idle time, all resources are in use, which means that more threads could be beneficial.
I/O threads (num.io.threads) pick up requests from the request queue to process them. Adding more threads can improve throughput, but the number of CPU cores and disk bandwidth imposes a practical upper limit.
A good starting point might be to start with the default of 8 multiplied by the number of disks.
Use num.recovery.threads.per.data.dir to specify the number of threads used for log loading at startup and flushing at shutdown.
# ...
num.io.threads=8
queued.max.requests=500
num.network.threads=3
num.recovery.threads.per.data.dir=1
# ...
Configuration updates to the thread pools for all brokers might occur dynamically at the cluster level. These updates are restricted to between half the current size and twice the current size.
If threads are slow or limited due to the number of disks, try increasing the size of the buffers for network requests to improve throughput:
# ...
replica.socket.receive.buffer.bytes=65536
# ...
And also increase the maximum number of bytes Kafka can receive:
# ...
socket.request.max.bytes=104857600
# ...
Increasing throughput for high latency connections
If you’ve fine-tuned the size of your message batches, the default values of the buffers for sending and receiving messages might be too small for the required throughput.
# ...
socket.send.buffer.bytes=1048576
socket.receive.buffer.bytes=1048576
# ...
If you want to change the values, you can work out the optimal size of your buffers using a bandwidth-delay product calculation. You need some figures to work with. Essentially, you want to multiply your bandwidth capacity with the round-trip delay to give the data volume. Go look at this wiki definition to see examples of the calculation.
Managing logs with data retention policies
Kafka uses logs to store message data. Logs are a series of segments with various associated indexes. New messages are written to a single active segment. The messages are never modified.
Using fetch requests, consumers read from the segments. After a time, the active segment is rolled to become read-only as a new active segment replaces it. Older segments are retained until they are eligible for deletion.
You can configure the maximum size in bytes of a log segment and the amount of time in milliseconds before an active segment is rolled.
Set them at the topic level using segment.bytes and segment.ms. Or set defaults at the broker level for any topics that do not have these settings:
# ...
log.segment.bytes=1073741824
log.roll.ms=604800000
# ...
Larger sizes mean the active segment contains more messages and is rolled less often. Non-active segments also become eligible for deletion less often.
You can set time-based or size-based log retention policies, in conjunction with the cleanup policies we cover next, so that logs are kept manageable. Non-active log segments are removed when retention limits are reached. By controlling the size of the log you retain, you can make sure that you’re not likely to exceed disk capacity.
For time-based log retention, use the milliseconds configuration, which has priority over the related minutes and hours configuration. The milliseconds configuration also updates dynamically, which the other configurations do not.
# ...
log.retention.ms=1680000
# ...
The retention period is based on the time messages were appended to the segment.
If log.retention.ms is set to -1, no time limit is applied to log retention, so all logs are retained. Disk usage should always be monitored, but the -1 setting is not generally recommended as it is especially likely to lead to issues with full disks, which can be hard to rectify.
For size-based log retention, set a maximum log size in bytes:
# ...
log.retention.bytes=1073741824
# ...
The maximum log size is for all segments in the log. In other words, a log will typically end up with approximately log.retention.bytes/log.segment.bytes segments once it reaches a steady state. When the maximum log size is reached, older segments are removed.
Setting a maximum log size does not consider the time messages were appended to a segment. If that’s a potential issue, you can use time-based and size-based retention. When you use both, the first threshold reached triggers the cleanup.
If you wish to add a time delay before a segment file is deleted from the system, you can add the delay using log.segment.delete.delay.ms for all topics at the broker level or file.delete.delay.ms for specific topics in the topic configuration.
# ...
log.segment.delete.delay.ms=60000
# ...
Removing log data with cleanup policies
Kafka’s log cleaner does what you expect.
It removes old data from the log.
Enabled by default (log.cleaner.enable=true), you can put some control on how the cleaner operates by defining a cleanup policy.
# ...
log.cleanup.policy=compact,delete
# ...
-
Delete policy
deletepolicy corresponds to managing logs with data retention policies. It’s suitable when data does not need to be retained forever. Older segments are deleted based on log retention limits. Otherwise, if the log cleaner is not enabled, and there are no log retention limits, the log will continue to grow. -
Compact policy
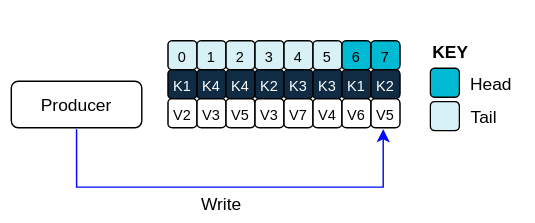
compactpolicy guarantees to keep the most recent message for each message key. Log compaction is suitable when message values are changeable, and you want to retain the latest update. New messages are appended to the head of the log, which acts in the same way as a non-compacted log with writes appended in order. In the tail of a compacted log, where the log cleaner operates, records will be deleted if another record with the same key occurs later in the log. So while Kafka guarantees that the latest messages for each key will be retained, it does not guarantee that the whole compacted log will not contain duplicates.
Log showing key value writes with offset positions before compaction
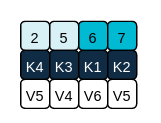
If you’re not using keys, you can’t use compaction as keys are needed to identify related messages. During log cleaning, the latest message (with the highest offset) is kept and older messages with the same key are discarded. Records retain their original offsets even when surrounding records get deleted. Consequently, the tail can have non-contiguous offsets. When consuming an offset that’s no longer available in the tail, the record with the next higher offset is found.
Log after compaction
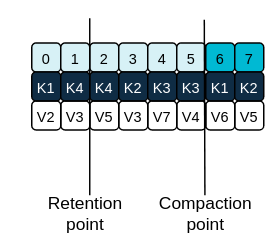
Logs can still become arbitrarily large using compaction alone if there’s no upper bound on the number of distinct keys. You can control this by setting policy to compact and delete logs. Log data is first compacted, removing older records that have a key in the head of the log. Then data that falls before the log retention threshold is deleted.
Log retention point and compaction point
Adjust the frequency the log is checked for cleanup in milliseconds using log.retention.check.interval.ms. Base the frequency on log retention settings. Cleanup should be often enough to manage the disk space, but not so often it affects performance on a topic. Smaller retention sizes might require more frequent checks. You can put the cleaner on standby if there are no logs to clean for a set period using log.cleaner.backoff.ms.
When deleting all messages related to a specific key, a producer sends a tombstone message, which has a null value and acts as a marker to tell a consumer the value is deleted. After compaction, only the tombstone is retained, which must be for a long enough period for the consumer to know that the message is deleted. Use log.cleaner.delete.retention.ms to make sure that consumers have the chance to read the final state of a deleted record before it is permanently deleted. When older messages are deleted, having no value, the tombstone key is also deleted from the partition.
# ...
log.retention.check.interval.ms=300000
log.cleaner.backoff.ms=15000
log.cleaner.delete.retention.ms=86400000
log.segment.delete.delay.ms=60000
# ...
Managing disk utilization
There are many other configuration settings related to log cleanup, but of particular importance is memory allocation.
The deduplication property specifies the total memory for cleanup across all log cleaner threads. You can set an upper limit on the percentage of memory used through the buffer load factor.
# ...
log.cleaner.dedupe.buffer.size=134217728
log.cleaner.io.buffer.load.factor=0.9
# ...
Each log entry uses exactly 24 bytes, so you can work out how many log entries the buffer can handle in a single run and adjust the setting accordingly.
If possible, consider increasing the number of log cleaner threads if you are looking to reduce the log cleaning time:
# ...
log.cleaner.threads=8
# ...
If you are experiencing issues with 100% disk bandwidth usage, you can throttle the log cleaner I/O so that the sum of the read/write operations is less than a specified double value based on the capabilities of the disks performing the operations:
# ...
log.cleaner.io.max.bytes.per.second=1.7976931348623157E308
# ...
Handling large message sizes
Ideally, individual messages aren’t more than a few 100KB, and are batched by the producer for better throughput up to the limit configured by message.max.bytes (broker config) or max.message.bytes (topic config). This defaults to 1MB.
You have four ways to handle large message sizes:
- Producer-side message compression
- Reference-based messaging
- Inline messaging
- Broker and producer/consumer configuration
We recommend trying producer-side message compression or reference-based messaging, which cover most situations.
Producer-side compression
For producer-side compression, you specify a compression.type, such as Gzip, to apply to batches. In the broker configuration, you use compression.type=producer so that the broker retains whatever compression the producer used. Generally speaking, it’s better that the producer and topic compression types match. Otherwise, the broker has to decompress and possibly recompress the batches before appending them to the log, which can be CPU intensive.
Compressing batches will add additional processing overhead on the producer and decompression overhead on the consumer. But you will get more data in a batch, which helps with throughput. You’ll also be able to make better use of your storage. Examine your metrics and combine producer-side compression with fine-tuning of the batch size to get the best outcome.
Reference-based messaging
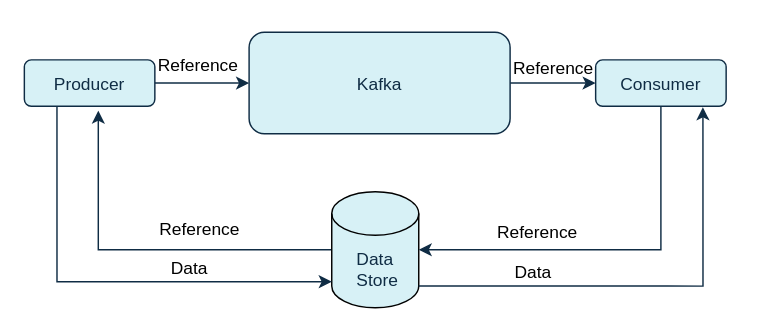
Reference-based messaging only sends a reference to data stored in some other system in the message’s value. This is useful for data replication when you do not know how big a message will be. It also works well when there’s an occasional large message, since the smaller messages can be sent directly through Kafka, and the large messages can be sent by reference. Data is written to the data store, which must be fast, durable, and highly available, and a reference to the data is returned. The producer sends the reference to Kafka. The consumer uses the reference to fetch the data from the data store.
Reference-based messaging flow
Referenced-based message passing requires more trips, so end-to-end latency will increase. One major drawback of this approach is that there is no automatic cleanup of the data in the external system when the Kafka message is cleaned up. There is also the risk that data could be removed from the external system before the message in Kafka gets deleted.
One way to mitigate the limitations of reference-based messaging is to take the hybrid approach briefly mentioned. Send large messages to the data store and process standard-sized messages directly.
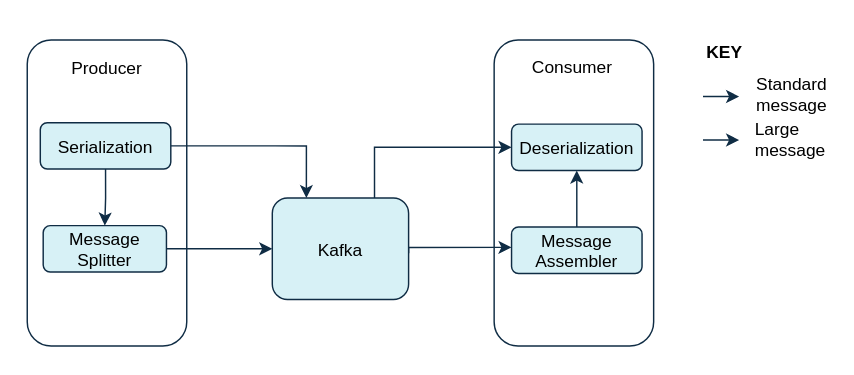
Inline messaging
Inline messaging is a complex process that splits messages into chunks that use the same key, which are then combined on output using a stream processor like Kafka Streams.
The basic steps are:
- The producing client application serializes then chunks the data if the message is too big.
- The producer uses the Kafka
ByteArraySerializeror similar to serialize each chunk again before sending it. - The consumer tracks messages and buffers chunks until it has a complete message.
- The consuming client application receives the chunks, which are assembled before deserialization.
- Complete messages are delivered to the rest of the consuming application in order according to the offset of the first or last chunk for each set of chunked messages.
- Successful delivery of the complete message is checked against offset metadata to avoid duplicates during a rebalance.
Inline messaging flow
Inline messaging does not depend on external systems like reference-based messaging. But it does have a performance overhead on the consumer side because of the buffering required, particularly when handling a series of large messages in parallel. The chunks of large messages can become interleaved, so that it is not always possible to commit when all the chunks of a message have been consumed if the chunks of another large message in the buffer are incomplete. For this reason, buffering is usually supported by persisting message chunks or by implementing commit logic.
Configuration to handle larger messages
You increase message limits by configuring message.max.bytes to set the maximum record batch size. You can set the limit at the topic level or the broker level. If you set limit at the broker level, larger messages are allowed for all topics and messages greater than the maximum limit are rejected. The buffer size for the producers (max.request.size) and consumers (message.max.bytes) must be able to accommodate the larger messages.
Controlling the log flush of message data
Usually, log flush thresholds are not usually set and the operating system performs a background flush using its default settings. But if you are using application flush management, setting lower flush thresholds might be appropriate if you are using faster disks.
Use the log flush properties to control the periodic writes of cached message data to disk. You can specify the frequency of checks on the log cache in milliseconds. Control the frequency of the flush based on the maximum amount of time that a message is kept in-memory and the maximum number of messages in the log before writing to disk.
# ...
log.flush.scheduler.interval.ms=2000
log.flush.interval.ms=50000
log.flush.interval.messages=100000
# ...
The wait between flushes includes the time to make the check and the specified interval before the flush is carried out. Increasing the frequency of flushes can affect throughput.
Partition rebalancing for availability
When replicating data across brokers, a partition leader on one broker handles all produce requests (writes to the log). Partition followers on other brokers replicate the partition data of the leader. So you get data reliability in the event of the leader failing. Followers need to be in sync for recovery, meaning the follower has caught up with the most recently committed message on the leader. If a leader is no longer available, one of the in-sync replicas is chosen as the new leader. The leader checks the follower by looking at the last offset requested.
An out-of-sync follower is usually not eligible as a leader should the current leader fail, unless unclean leader election is allowed.
You can adjust the lag time before a follower is considered out of sync:
# ...
replica.lag.time.max.ms
# ...
Lag time puts an upper limit on the time to replicate a message to all in-sync replicas and how long a producer has to wait for an acknowledgment. If a follower fails to make a fetch request and catch up with the latest message within the specified lag time, it is removed from in-sync replicas. The time you use depends on both network latency and broker disk bandwidth. You can reduce the lag time to detect failed replicas sooner, but by doing so you increase the chances of followers falling out of sync needlessly
Followers operate only to replicate messages from the partition leader and allow recovery should the leader fail. Followers do not normally serve clients, though rack configuration allows a consumer to consume messages from the closest replica when a Kafka cluster spans multiple datacenters.
You can use Cruise Control for Strimzi to figure out replica assignments to brokers that balance load evenly across the cluster. Its calculation takes into account the differing load experienced by leaders and followers. A failed leader affects the balance of a Kafka cluster because the remaining brokers get the extra work of leading additional partitions.
For the assignment found by Cruise Control to actually be balanced it is necessary that partitions are lead by the preferred leader. Kafka can automatically ensure that the preferred leader is being used (where possible), changing the current leader if necessary. This ensures that the cluster remains in the balanced state found by Cruise Control.
You can control the frequency, in seconds, of automatic preferred leader checks and the maximum percentage of imbalance allowed for a broker before a rebalance is triggered.
#...
auto.leader.rebalance.enable=true
leader.imbalance.check.interval.seconds=300
leader.imbalance.per.broker.percentage=10
#...
The percentage leader imbalance for a broker is the ratio between the current number of partitions for which the broker is the current leader and the number of partitions for which it is the preferred leader. You can set the percentage to zero to ensure that preferred leaders are always elected, assuming they are in sync.
If the checks for rebalances need more control, you can disable automated rebalances. You can then choose when to trigger a rebalance using the kafka-leader-election.sh command line tool.
The Grafana dashboards provided with Strimzi show metrics for under-replicated partitions and partitions that do not have an active leader.
Unclean leader election
Leader election to an in-sync replica is considered clean because it guarantees no loss of data. And this is what happens by default. If no other broker was in the ISR (in-sync replica) when the old leader was lost, Kafka waits until that leader is back online before messages can be written or read.
But what if there is no in-sync replica to take on leadership? Perhaps the ISR only contained the leader when the leader’s disk died. If a minimum number of in-sync replicas is not set, and there are no followers in sync with the partition leader when its hard drive fails irrevocably, data is already lost. Not only that, but a new leader cannot be elected because there are no in-sync followers.
If your situation favors availability over durability, you might want to enable unclean leader election.
# ...
unclean.leader.election.enable=false
# ...
Unclean leader election means out-of-sync replicas can become leaders, but you risk losing messages.
Avoiding unnecessary consumer group rebalances
We’ll end this exploration of broker tuning tips by suggesting a very useful configuration to avoid unnecessary consumer group rebalances. You can add a delay so the group coordinator waits for members to join before the initial rebalance:
# ...
group.initial.rebalance.delay.ms=3000
# ...
Inevitably, there’s a trade-off as the delay prevents the group from consuming until the period has ended.
And as we come to end of his post, we can make a general point about any tuning you undertake. Have a clear idea of what you hope to achieve with your tuning, but be mindful of what compromises you might have to make to achieve the outcome you seek.
Conclusion
So that completes a targeted roundup of the most common broker tuning options for your consideration. Try them out and keep your messages flowing.
Share this:
![]()
![]()
![]()
![]()
![]()