Apache Kafka has emerged as a popular platform for event and data streaming, providing a reliable backbone for microservices communication in distributed systems. One of the most challenging aspects of working with distributed systems is gaining visibility into the data flow and accurately assessing performance. This is where distributed tracing comes into the picture, by addressing the following issues:
- Monitoring the flow of events or remote procedure calls between applications.
- Profiling message latency in order to help optimizing performance.
- Providing an overall picture about how microservices communicate across boundaries.
Strimzi has provided tracing support, for Kafka Connect, Kafka MirrorMaker and the Kafka Bridge, since the 0.14.0 release by leveraging the OpenTracing project. But since then, the distributed tracing ecosystem has changed. The OpenTracing project was archived and replaced by a new project, OpenTelemetry.
Tha Apache Kafka project itself doesn’t have support for tracing, so when messages flow through brokers no further tracing information is added.
This blog post will show you how to use OpenTelemetry within the Strimzi project and what are the differences with OpenTracing, which is now deprecated and will be removed in the coming months.
What is OpenTelemetry?
OpenTelemetry is an open source and vendor neutral project providing tools, APIs, and SDKs used to generate, collect and export telemetry data. It is part of the Cloud Native Computing Foundation and it is available across several languages. It is not just about tracing, as the OpenTelemetry project has support for metrics and logs as well. The Strimzi project support of OpenTelemetry is about tracing only. There are no actual plans to support OpenTelemetry metrics and logs at this time.
OpenTracing support in Strimzi is strictly coupled with the Jaeger implementation, as it uses the Jaeger client underneath, but with OpenTelemetry we have a different approach. The tracer uses an exporter in order to export traces in a specific format to the backend system. While a Jaeger-based exporter is available to allow current users to continue using the Jaeger protocol, the OTLP (OpenTeLemetry Protocol) exporter is used by default and the OpenTelemetry community encourages its adoption. You can also use Zipkin or develop your own exporter for a custom backend system.
Using a specific exporter protocol means that the corresponding backend system has to support it. It has to provide an endpoint to which the traces are sent by using that specific protocol. For example, you can still use the Jaeger backend with the OTLP exporter protocol, because newer Jaeger releases since 1.35 expose an OTLP endpoint. You could also decide to use the usual Jaeger protocol endpoint by setting the corresponding Jaeger exporter in your system.
From an application perspective, the way OpenTelemetry works is similar to OpenTracing. The tracer is part of your application and it provides the API for creating trace spans and using the configured exporter to send them. Focusing on Apache Kafka, the application could be a producer or consumer, or one of the components managed by the Strimzi operator, such as Kafka Connect, Kafka MirrorMaker and the Kafka Bridge.
As it happens, with OpenTracing even the OpenTelemetry exporter doesn’t send all traces but often just part of them by using sampling.
How to enable OpenTelemetry
Prior to the addition of OpenTelemetry support, users could enable distributed tracing on custom resources such as KafkaConnect, KafkaMirrorMaker, KafkaMirrorMaker2, and KafkaBridge by setting the spec.tracing.type property to jaeger, which allowed them to use OpenTracing.
Since Strimzi 0.33.0, you can use OpenTelemetry instead by setting that property to opentelemetry.
# ...
spec:
  # ...
  tracing:
    type: opentelemetry
  # ...
With the above setting, the Strimzi operator initializes the OpenTelemetry tracer using the default OTLP exporter, for sending traces to the tracing backend.
But you also need to specify environment variables to configure the exporter itself, by using the spec.template properties.
Here is an example KafkaBridge configuration:
spec:
  #...
  template:
    bridgeContainer:
      env:
        - name: OTEL_SERVICE_NAME
          value: my-bridge-otel-service
        - name: OTEL_EXPORTER_OTLP_ENDPOINT
          value: "http://jaeger-host:4317"
  tracing:
    type: opentelemetry
This example is using my-bridge-otel-service as the service name.
For example if you are using a Jaeger backend, this name will appear in the list of available services in the UI.
The service name is specific to the operand you are using in order to group multiple traces together. You should use a different service name for any other operand (i.e. Kafka Connect, Kafka MirrorMaker, …)
Assuming, for example, you are using Jaeger backend, it configures the tracer to send the traces to the http://jaeger-host:4317 OTLP endpoint on the backend. The jaeger-host is just a placeholder for the Jaeger backend URL. The port 4317 is where the OTLP endpoint is exposed.
By default, the exporter uses the OTLP protocol which has to be enabled on the Jaeger backend.
If you want to change to a different exporting protocol, for example using the jaeger one, set the OTEL_TRACES_EXPORTER environment variable as well, but you also need to add the corresponding artifact in the Kafka image. For more more details about how to do that, see the Strimzi documentation.
You would also need to set the OTEL_EXPORTER_JAEGER_ENDPOINT instead of the above OTEL_EXPORTER_OTLP_ENDPOINT to specify a Jaeger protocol endpoint.
If you are using Jaeger as the backend system for tracing, you need to have Jaeger 1.35 at least, which is the first to expose an OTLP endpoint. Find more details about starting the backend with the
COLLECTOR_OTLP_ENABLEDenvironment variable set in the Jaeger documentation.
OpenTelemetry in action
Assuming you already have the Strimzi operator running on your Kubernetes instance, together with an Apache Kafka cluster, the first step to using OpenTelemetry is to install a tracing backend to get the traces from your applications. As already mentioned, the Jaeger backend can still be used together with the OTLP endpoint enabled, so let’s use this one.
Installing the Jaeger backend
The easiest way to deploy the Jaeger backend on Kubernetes is to use the Jaeger Operator. One of the pre-requisites for the latest releases is having the cert-manager already installed as well.
You can install cert-manager by running the following command:
kubectl apply -f https://github.com/cert-manager/cert-manager/releases/download/v1.6.3/cert-manager.yaml
After that, install the Jaeger Operator in the observability namespace:
kubectl create namespace observability
kubectl create -f https://github.com/jaegertracing/jaeger-operator/releases/download/v1.41.0/jaeger-operator.yaml -n observability
With the Jaeger Operator up and running, you can now create a Jaeger custom resource describing the Jaeger instance to install.
The simplest Jaeger definition is enough for our purposes:
apiVersion: jaegertracing.io/v1
kind: Jaeger
metadata:
  name: simplest
Create a simplest-jaeger.yaml file with the above declaration and install it:
kubectl apply -f simplest-jaeger.yaml
With the Jaeger instance running, an OTLP endpoint for getting the traces is exposed through the http://simplest-collector:4317 service.
If using Minikube, you can use port-forwarding to easily access the Jaeger Web UI from your local browser at
http://localhost:16686. Just use the following commandkubectl port-forward svc/simplest-query 16686:16686.
For more details, the official Jaeger documentation explains all the steps.
Let’s trace the Kafka Bridge traffic
Let’s take the Strimzi Kafka Bridge as an example of tracing to show how OpenTelemetry works.
The first step is to deploy a KafkaBridge instance with tracing enabled and the corresponding environment variables to configure the OTLP exporter.
apiVersion: kafka.strimzi.io/v1beta2
kind: KafkaBridge
metadata:
  name: my-bridge
spec:
  replicas: 1
  bootstrapServers: my-cluster-kafka-bootstrap:9092
  http:
    port: 8080
  template:
    bridgeContainer:
      env:
        - name: OTEL_SERVICE_NAME
          value: my-bridge-otel-service
        - name: OTEL_EXPORTER_OTLP_ENDPOINT
          value: http://simplest-collector:4317
  tracing:
    type: opentelemetry
With the Kafka Bridge running, we can use any HTTP client for sending and receiving messages.
It could be a simple command line tool like cURL, a more UI oriented like Postman or whatever you prefer.
You could also use an application you developed with your preferred language.
For the purpose of this blog post, we use the Java HTTP client examples from the Strimzi repository.
By getting the deployment-tracing-opentelemetry.yaml YAML file you are able to deploy the following:
- A producer Java HTTP client which sends a message every second to the Apache Kafka cluster through the Kafka Bridge.
- A consumer Java HTTP client which polls for messages every second from the Apache Kafka cluster through the Kafka Bridge.
Both applications are configured in order to trace the HTTP requests they send to the bridge.
Get the above file and change the OpenTelemetry exporter configuration OTEL_EXPORTER_OTLP_ENDPOINT environment variable related to the Jaeger OTLP endpoint for sending the traces.
env:
  # ...
  - name: OTEL_EXPORTER_OTLP_ENDPOINT
    value: http://simplest-collector:4317
  # ...
Save and deploy the YAML:
kubectl apply -f deployment-tracing-opentelemetry.yaml
When the HTTP clients exchange the messages we can see the traces and the corresponding spans in the Jaeger Web UI.
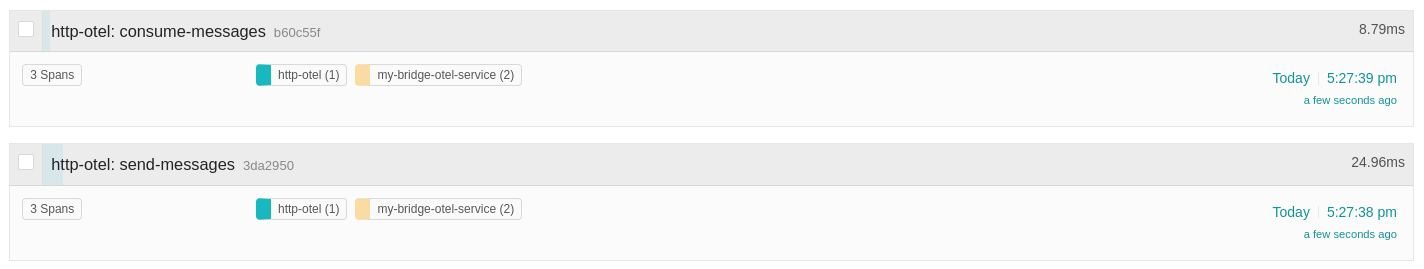
In the above screen capture, the HTTP producer sends a message and it is received by the HTTP consumer.
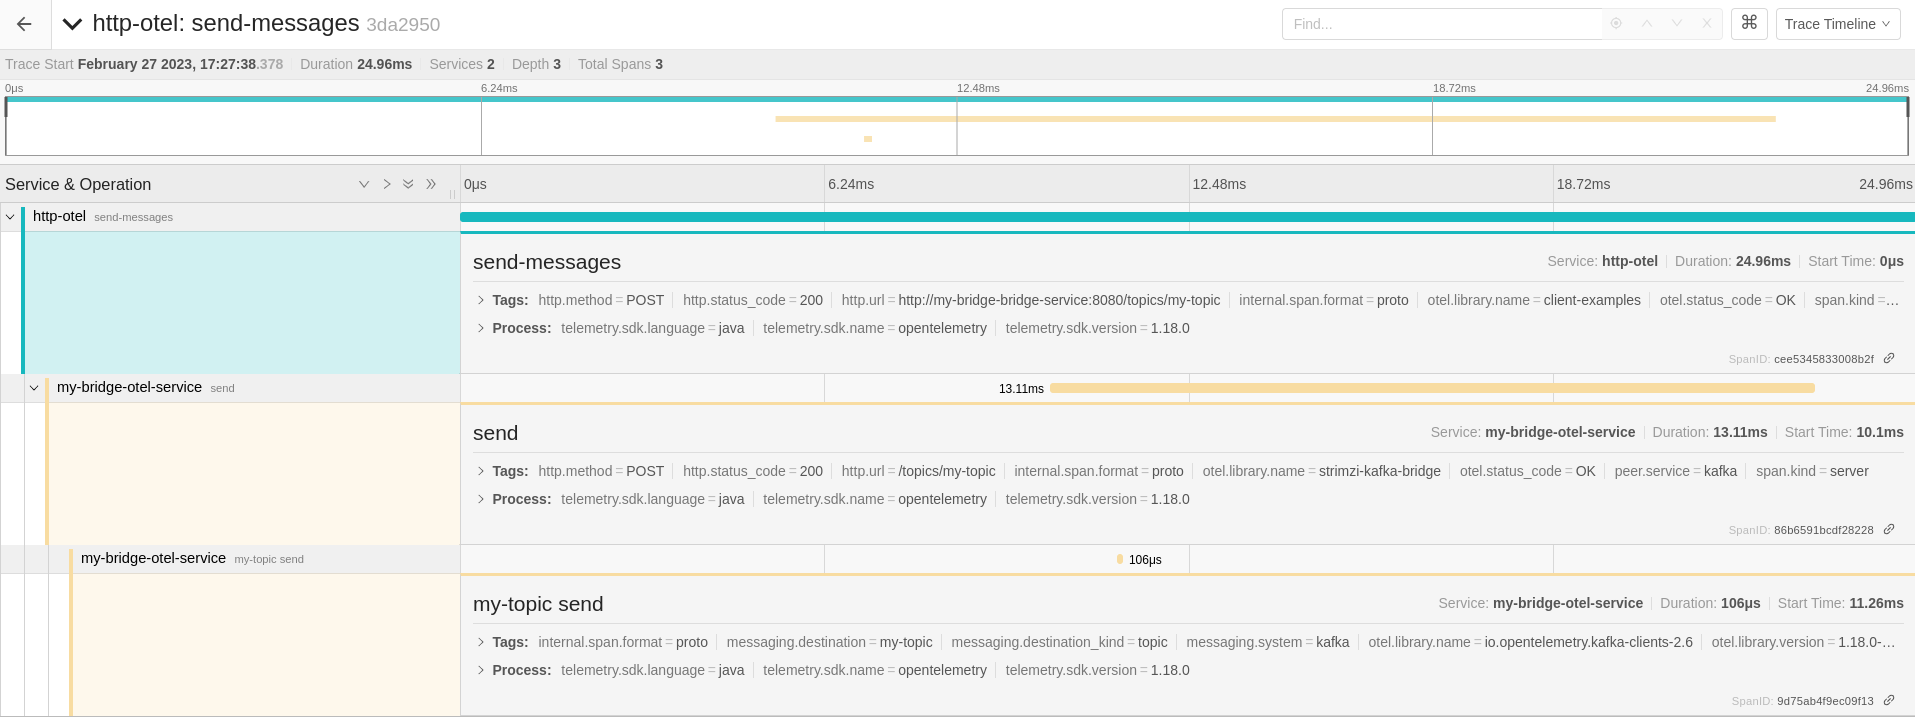
When the HTTP client sends a producer request, you can see three spans linked together as part of the same trace:
- The first span describes the HTTP
send-messagesoperation generated on the client and propagated to the bridge. This span is created by the HTTP producer client itself instrumented with OpenTelemetry. - The second span describes the HTTP
sendoperation requested by the client and tracked on the bridge. This span is created by the bridge application itself instrumented with OpenTelemetry. It is linked to the first span with a “CHILD_OF” relationship. - The third span describes the low level Kafka
sendoperation to themy-topictopic which is a “CHILD_OF” the previous one. This span is created by the instrumented Kafka client provided by the OpenTelemetry project. It uses a producer interceptor for creating the span.
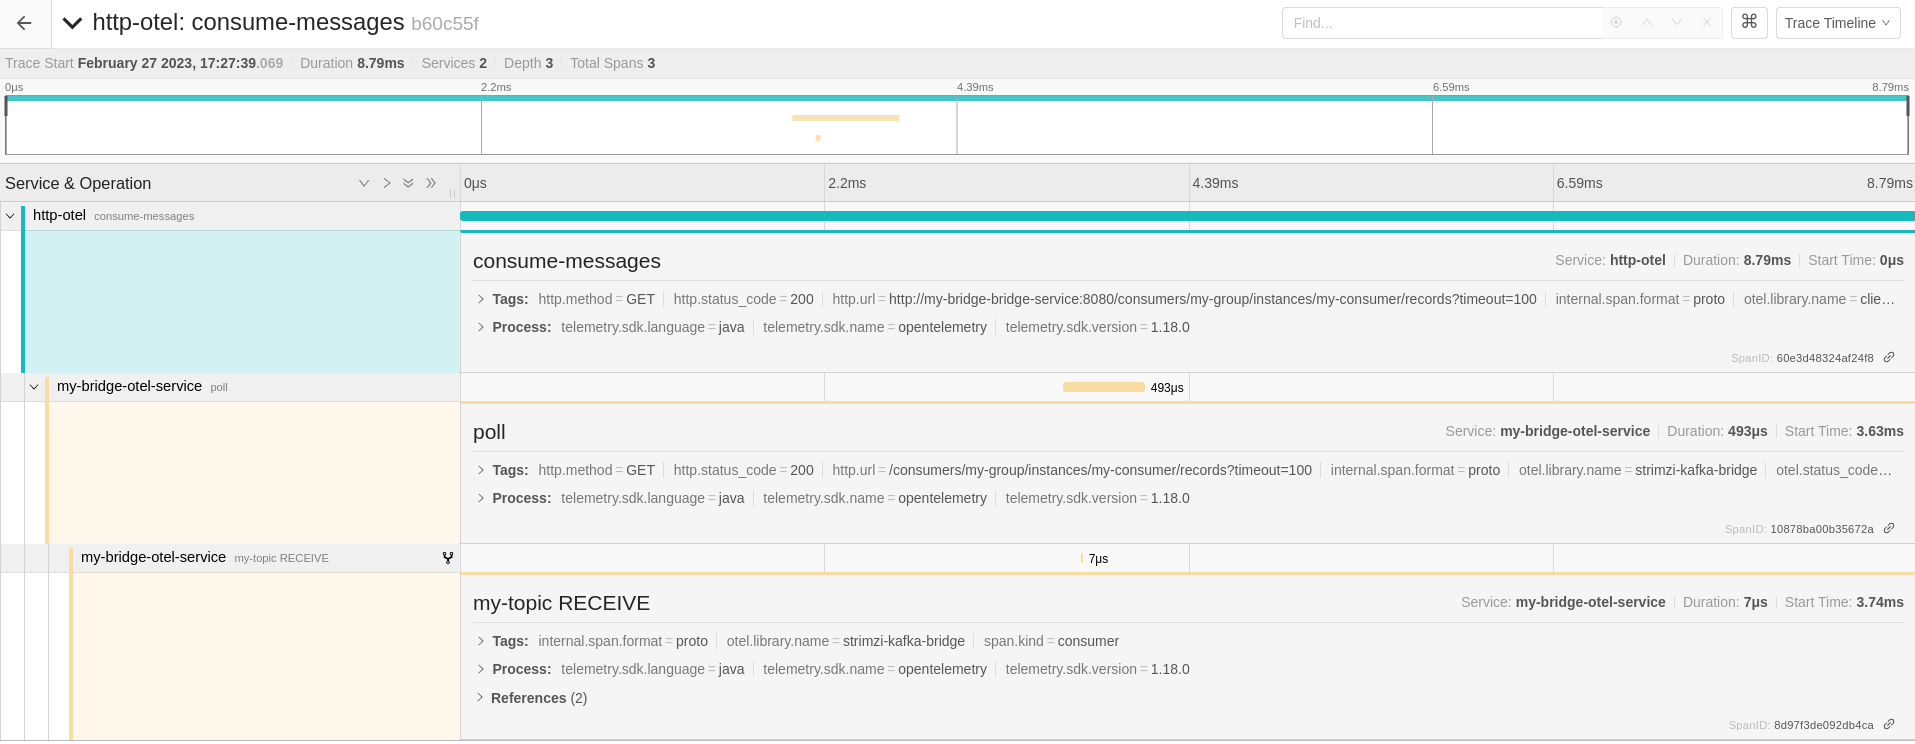
In the same way, when the HTTP consumer sends a poll request for receiving the messages, you can see three spans linked together as part of the same trace:
- The first span describes the HTTP
consume-messagesoperation generated on the client and propagated to the bridge. This span is created by the HTTP consumer client itself instrumented with OpenTelemetry. - The second span describes the HTTP
polloperation requested by the client and tracked on the bridge. This span is created by the bridge application itself instrumented with OpenTelemetry. It is linked to the first span with a “CHILD_OF” relationship. - The third span describes the low level Kafka
receiveoperation on themy-topictopic related to the message received. It is “CHILD_OF” the previous span but at the same time it is referencing the external trace related to the producer with a “FOLLOW_FROM” relationship. This span is created by the instrumented Kafka client provided by the OpenTelemetry project.
It is interesting to highlight that, due to the asynchronous nature of the communication between producer and consumer through the Kafka Bridge and Kafka, the producing and consuming parts are traced with two different traces. The consumer-related spans are linked to the producing trace spans by using a “FOLLOW_FROM” relationship. This takes into account that the same messages could be consumed by multiple consumers or read again by the same consumer in the future. Having different consumer traces linked to the producer trace makes more sense than having a bigger trace that is not so easy to navigate.
Adding OpenTelemetry tracing to Kafka Connect and MirrorMaker
As already mentioned before, Strimzi supports tracing on Kafka Connect and MirrorMaker. In a previous blog post we already covered them by using OpenTracing at that time. In order to use OpenTelemetry instead, the set up is quite similar but with the following changes:
- The
spec.tracing.typehas to beopentelemetry. - The environment variables to be set in the
spec.templateare the ones related to OpenTelemetry as with the Kafka Bridge example.
By using Jaeger as the backend, you get the traces the same way as described in the OpenTracing blog post.
Adding OpenTelemetry tracing to client applications
Of course, OpenTelemetry can be used to add tracing to your application as well. The purpose is about having end-to-end tracing information from producer to consumer, not only related to the components where the messages are flowing through, like Kafka Bridge. This is not something Strimzi-specific but it is mostly about using the OpenTelemetry instrumentation libraries. The Java HTTP clients we used with the bridge are good examples of instrumenting an application using OpenTelemetry. For a smoother approach on instrumenting their application, you can find more details in the Strimzi documentation for initializing tracing for Kafka clients. The documentation guides you through instrumenting Kafka client API based applications as well as Kafka Streams applications.
You can also read more on this blog post on the OpenTelemetry website.
Conclusion
Evaluating performance and getting insights about issues in a distributed system is a really complex task. This is where distributed tracing helps. After the OpenTracing project was archived, the Cloud Native Computing Foundation community moved to a shiny new project, OpenTelemetry. Strimzi is already moving forward in that direction, by deprecating OpenTracing and providing you support for OpenTelemetry. The plan is to support, if possible, OpenTracing until June 2023 and remove it afterward. We encourage you to move as soon as possible. In the coming months, the OpenTracing support will be removed from all the Strimzi components and OpenTelemetry will be the only supported tracing option. For any kind of problems don’t hesitate to get in touch with the Strimzi community, we’ll be happy to help you!
Share this:
![]()
![]()
![]()
![]()
![]()